4. What is the range (_sxs_) of the data values that would allow 55% of the data to fall within the mean observing symmetry? Draw the curve and show your complete solution. A 4. 1 6 A0. G TE Nr oF e t uES T AL e ne ane TO PAL E N teNE UEN .26 LIG ** 10. 45 The range of data values that will allow 55% of the data to fall within the mean of symmetry is 7.0625 and 10.3375 5. What is the variance of this data set? o? = (2.1546)? g² = 4.6423 Given that the standard deviation is 2.1546 and it is the square root of the variance, the value of the variance is 4.6423. 6. Are there any outliers with this data set? (Outliers refer to data points that lie beyond 3 standard deviation from the mean). There are no outliers with this data set since all values in the data set do not go beyond the three standard deviations from the mean.
4. What is the range (_sxs_) of the data values that would allow 55% of the data to fall within the mean observing symmetry? Draw the curve and show your complete solution. A 4. 1 6 A0. G TE Nr oF e t uES T AL e ne ane TO PAL E N teNE UEN .26 LIG ** 10. 45 The range of data values that will allow 55% of the data to fall within the mean of symmetry is 7.0625 and 10.3375 5. What is the variance of this data set? o? = (2.1546)? g² = 4.6423 Given that the standard deviation is 2.1546 and it is the square root of the variance, the value of the variance is 4.6423. 6. Are there any outliers with this data set? (Outliers refer to data points that lie beyond 3 standard deviation from the mean). There are no outliers with this data set since all values in the data set do not go beyond the three standard deviations from the mean.

Glencoe Algebra 1, Student Edition, 9780079039897, 0079039898, 2018
18th Edition
ISBN:9780079039897
Author:Carter
Publisher:Carter
Chapter10: Statistics
Section: Chapter Questions
Problem 25SGR

Related questions
Question
answer 4 5 6 handwritten
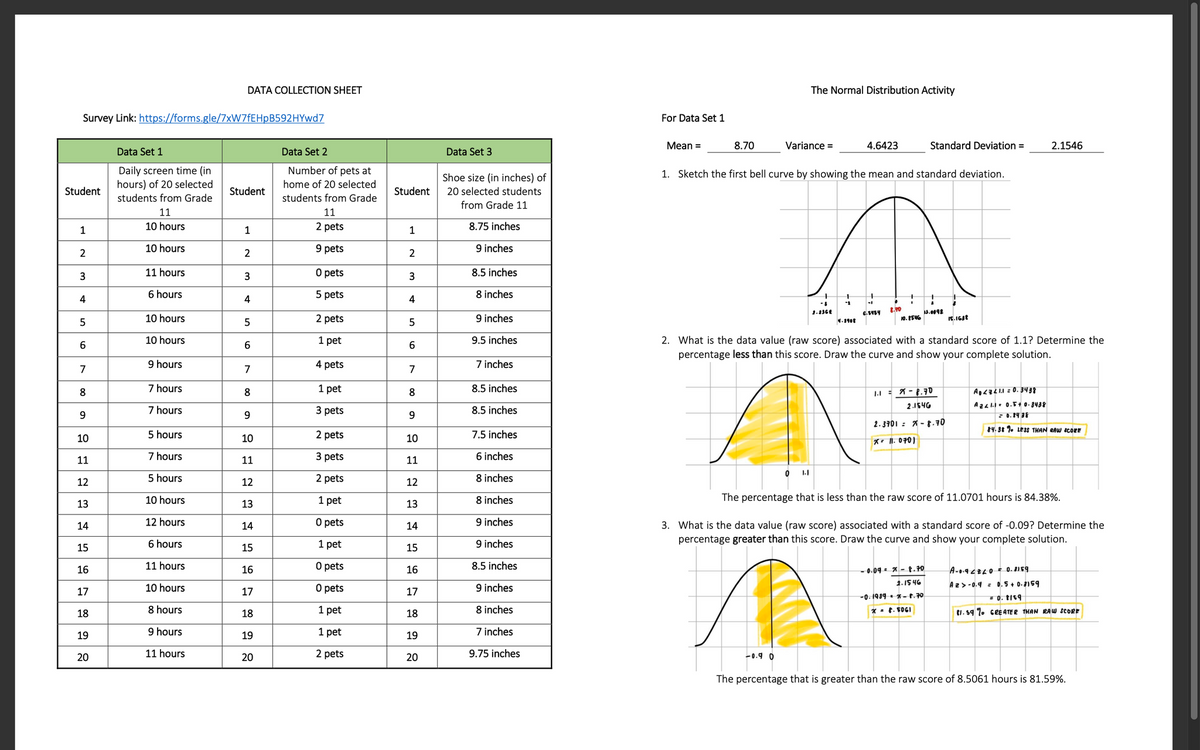
Transcribed Image Text:DATA COLLECTION SHEET
The Normal Distribution Activity
Survey Link: https://forms.gle/7XW7ÉEHPB592HYWD7
For Data Set 1
Mean =
8.70
Variance =
4,6423
Standard Deviation =
2.1546
Data Set 1
Data Set 2
Data Set 3
Number of pets at
Daily screen time (in
hours) of 20 selected
students from Grade
1. Sketch the first bell curve by showing the mean and standard deviation.
Shoe size (in inches) of
20 selected students
home of 20 selected
Student
Student
Student
students from Grade
11
2 pets
from Grade 11
11
8.75 inches
10 hours
1
1
1
10 hours
9 pets
9 inches
2
3
11 hours
3
O pets
3
8.5 inches
6 hours
4
5 pets
4
8 inches
5
10 hours
5
2 pets
5
9 inches
10 hours
1 pet
9.5 inches
2. What is the data value (raw score) associated with a standard score of 1.1? Determine the
percentage less than this score. Draw the curve and show your complete solution.
6.
6
6.
9 hours
4 pets
7 inches
7
7
7
8
7 hours
8.
1 pet
8
8.5 inches
7 hours
3 pets
8.5 inches
9.
9
2. 3101 : X-t.10
H.. THAN aer
10
5 hours
10
2 pets
10
7.5 inches
11
7 hours
11
3 pets
11
6 inches
O LI
12
5 hours
12
2 pets
12
8 inches
13
10 hours
13
1 pet
13
8 inches
The percentage that is less than the raw score of 11.0701 hours is 84.38%.
12 hours
O pets
9 inches
3. What is the data value (raw score) associated with a standard score of -0.09? Determine the
percentage greater than this score. Draw the curve and show your complete solution.
14
14
14
6 hours
1 pet
9 inches
15
15
15
16
11 hours
16
O pets
16
8.5 inches
-0.09-x-t.K
1.15 46
17
10 hours
17
O pets
17
9 inches
0. tisg
18
8 hours
18
1 pet
18
8 inches
19
9 hours
19
1 pet
19
7 inches
20
11 hours
20
2 pets
20
9.75 inches
-0.4 0
The percentage that is greater than the raw score of 8.5061 hours is 81.59%.
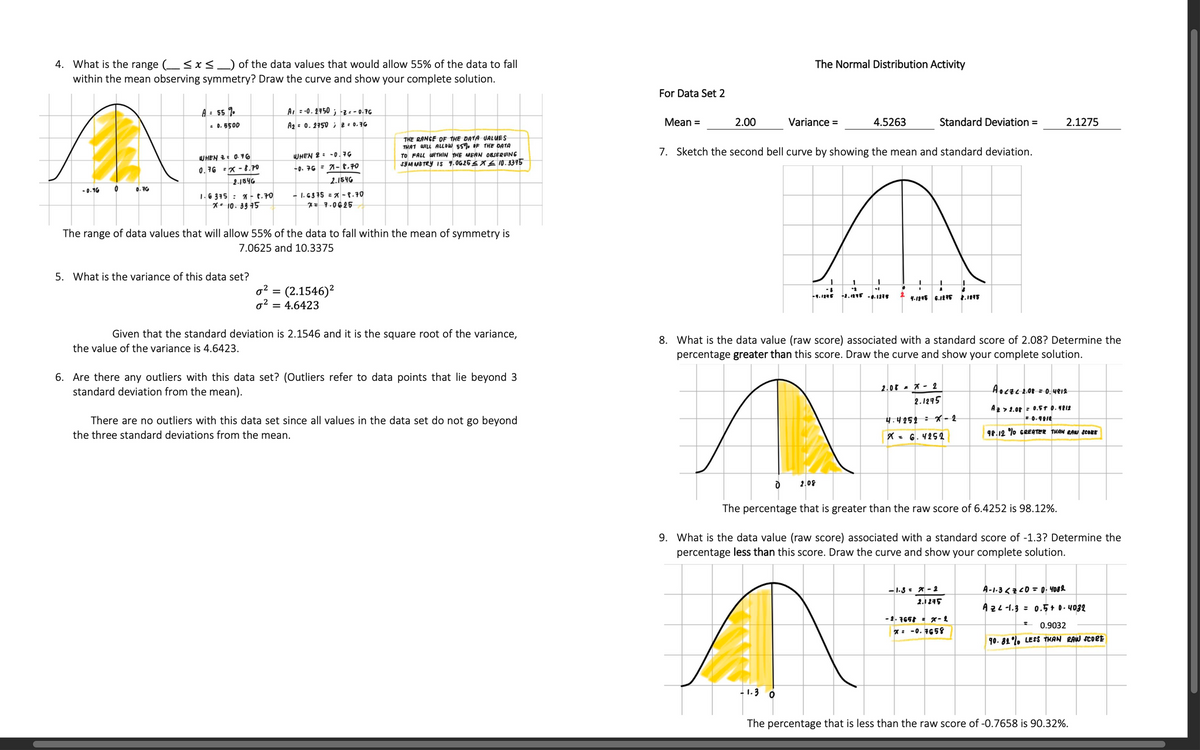
Transcribed Image Text:4. What is the range (sxs_) of the data values that would allow 55% of the data to fall
within the mean observing symmetry? Draw the curve and show your complete solution.
The Normal Distribution Activity
For Data Set 2
A. 4. 110 ;..16
A 0. 150 1G
..500
Mean =
2.000
Variance =
4.5263
Standard Deviation =
2.1275
THE RANGE OF THE DATA UALUES
7. Sketch the second bell curve by showing the mean and standard deviation.
UHEN -0,G
TO PALL n E MERN ORsrenNE
0.16 x-t.
. G A-t.t0
hart
1.6 315 : - t.10
** 10. 945
- 6SIS x-.10
11.0025
The range of data values that will allow 55% of the data to fall within the mean of symmetry is
7.0625 and 10.3375
5. What is the variance of this data set?
g? = (2.1546)?
g? = 4.6423
Given that the standard deviation is 2.1546 and it is the square root of the variance,
8. What is the data value (raw score) associated with a standard score of 2.08? Determine the
percentage greater than this score. Draw the curve and show your complete solution.
the value of the variance is 4.6423.
6. Are there any outliers with this data set? (Outliers refer to data points that lie beyond 3
standard deviation from the mean).
2.0r- X- 1
2.1215
Aocecior 0. vers
A1.0. .r .
There are no outliers with this data set since all values in the data set do not go beyond
the three standard deviations from the mean.
4.4151 X-
*. G. V252
r.12 o cereee T e eer
2.09
The percentage that is greater than the raw score of 6.4252 is 98.12%.
9. What is the data value (raw score) associated with a standard score of -1.3? Determine the
percentage less than this score. Draw the curve and show your complete solution.
-1.3.-1
2.1245
Aze -1.3 = 0.5+ D. v032
- 0.9032
*. -0. 165
90. 81, Lert HAN RAW SCoet
1.3 0
The percentage that is less than the raw score of -0.7658 is 90.32%.
Expert Solution
This question has been solved!
Explore an expertly crafted, step-by-step solution for a thorough understanding of key concepts.

Step by step
Solved in 3 steps

Recommended textbooks for you
Glencoe Algebra 1, Student Edition, 9780079039897…
Algebra
ISBN:
9780079039897
Author:
Carter
Publisher:
McGraw Hill
Glencoe Algebra 1, Student Edition, 9780079039897…
Algebra
ISBN:
9780079039897
Author:
Carter
Publisher:
McGraw Hill