4.2.19. Let X₁, X2..... X be a random sample from a gamma distribution with known parameter a = 3 and unknown 3 > 0. In Exercise 4.2.14, we obtained an approximate confidence interval for 3 based on the Central Limit Theorem. In this exercise obtain an exact confidence interval by first obtaining the distribution of 22{ X./β. Hint: Follow the procedure outlined in Exercise 4.2.18.
4.2.19. Let X₁, X2..... X be a random sample from a gamma distribution with known parameter a = 3 and unknown 3 > 0. In Exercise 4.2.14, we obtained an approximate confidence interval for 3 based on the Central Limit Theorem. In this exercise obtain an exact confidence interval by first obtaining the distribution of 22{ X./β. Hint: Follow the procedure outlined in Exercise 4.2.18.

A First Course in Probability (10th Edition)
10th Edition
ISBN:9780134753119
Author:Sheldon Ross
Publisher:Sheldon Ross
Chapter1: Combinatorial Analysis
Section: Chapter Questions
Problem 1.1P: a. How many different 7-place license plates are possible if the first 2 places are for letters and...

Related questions
Question
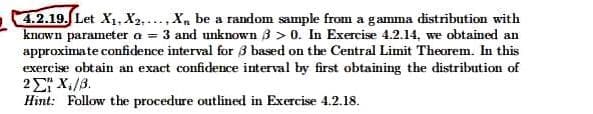
Transcribed Image Text:4.2.19. Let X₁, X2..... X be a random sample from a gamma distribution with
known parameter a = 3 and unknown 3 > 0. In Exercise 4.2.14, we obtained an
approximate confidence interval for 3 based on the Central Limit Theorem. In this
exercise obtain an exact confidence interval by first obtaining the distribution of
22 X./β.
Hint: Follow the procedure outlined in Exercise 4.2.18.
Expert Solution
This question has been solved!
Explore an expertly crafted, step-by-step solution for a thorough understanding of key concepts.

This is a popular solution!

Trending now
This is a popular solution!

Step by step
Solved in 4 steps with 4 images

Recommended textbooks for you
A First Course in Probability (10th Edition)
Probability
ISBN:
9780134753119
Author:
Sheldon Ross
Publisher:
PEARSON

A First Course in Probability (10th Edition)
Probability
ISBN:
9780134753119
Author:
Sheldon Ross
Publisher:
PEARSON