An experiment is conducted to determine whether there is a differnce among the mean increases in growth produced by five strains (A, B, C, D and E) of growth hormones for plants. The experimental material consists of 20 cuttings of a si qual weight), with four cuttings randomly assigned to each of the five different strains. The increases in weight for each cutting along with the sample mean and sample standard deviation of each group are given in the table below. A B с D E 24 17 15 Plant 1 10 29 Plant 2 17 28 25 19 13 Plant 3 14 22 22 13 15 Plant 4 17 20 22 12 11 Mean 14.5 24.75 23.25 15.25 13.5 tandard Dev 3.3166 4.4253 1.5000 3.3040 1.9149
An experiment is conducted to determine whether there is a differnce among the mean increases in growth produced by five strains (A, B, C, D and E) of growth hormones for plants. The experimental material consists of 20 cuttings of a si qual weight), with four cuttings randomly assigned to each of the five different strains. The increases in weight for each cutting along with the sample mean and sample standard deviation of each group are given in the table below. A B с D E 24 17 15 Plant 1 10 29 Plant 2 17 28 25 19 13 Plant 3 14 22 22 13 15 Plant 4 17 20 22 12 11 Mean 14.5 24.75 23.25 15.25 13.5 tandard Dev 3.3166 4.4253 1.5000 3.3040 1.9149

Glencoe Algebra 1, Student Edition, 9780079039897, 0079039898, 2018
18th Edition
ISBN:9780079039897
Author:Carter
Publisher:Carter
Chapter10: Statistics
Section10.4: Distributions Of Data
Problem 19PFA

Related questions
Question
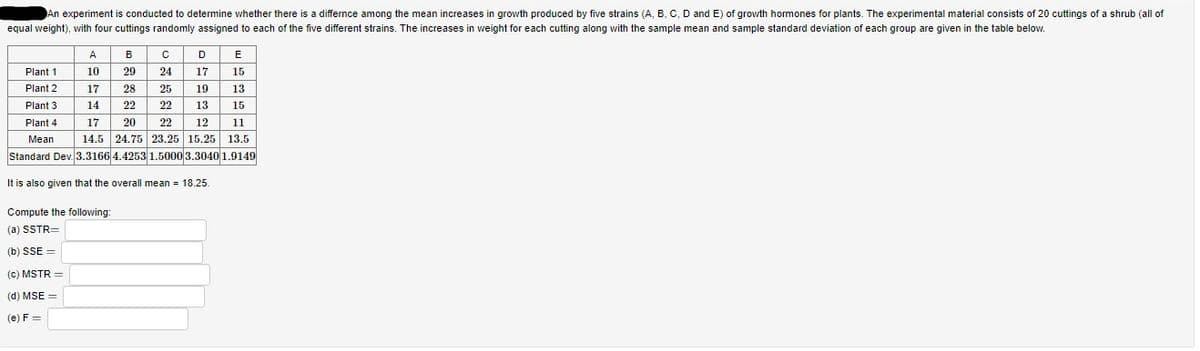
Transcribed Image Text:An experiment is conducted to determine whether there is a differnce among the mean increases in growth produced by five strains (A, B, C, D and E) of growth hormones for plants. The experimental material consists of 20 cuttings of a shrub (all of
equal weight), with four cuttings randomly assigned to each of the five different strains. The increases in weight for each cutting along with the sample mean and sample standard deviation of each group are given in the table below.
A
B
C
D
E
Plant 1
10
29
24 17
15
Plant 2
17
28
25
19
13
Plant 3
14
22
22
13 15
Plant 4
17
20
22
12
11
Mean
14.5
24.75 23.25 15.25 13.5
Standard Dev. 3.3166 4.4253 1.5000 3.3040 1.9149
It is also given that the overall mean 18.25.
Compute the following:
(a) SSTR=
(b) SSE =
(c) MSTR =
(d) MSE =
(e) F=
Expert Solution
This question has been solved!
Explore an expertly crafted, step-by-step solution for a thorough understanding of key concepts.

This is a popular solution!

Trending now
This is a popular solution!

Step by step
Solved in 2 steps

Recommended textbooks for you
Glencoe Algebra 1, Student Edition, 9780079039897…
Algebra
ISBN:
9780079039897
Author:
Carter
Publisher:
McGraw Hill
Glencoe Algebra 1, Student Edition, 9780079039897…
Algebra
ISBN:
9780079039897
Author:
Carter
Publisher:
McGraw Hill