40 51 43 1. 44 43 41 41 42 42 42 42 41 Frequency 45 44 41 46 43 46 41 45 43 40 41 42 43 41 44 44 45 Find the mean, the standard deviation, and the variance of the dota. Interpret the calculation of the standard deviation. (See question 5 for assistance). 47 2. Use the graph below to describe the distribution of pepperoni counts for the sample of pizzas. 41 49 50 51 52 53 48 47 46 45 Pepperonis on a 24-inch Pizza
40 51 43 1. 44 43 41 41 42 42 42 42 41 Frequency 45 44 41 46 43 46 41 45 43 40 41 42 43 41 44 44 45 Find the mean, the standard deviation, and the variance of the dota. Interpret the calculation of the standard deviation. (See question 5 for assistance). 47 2. Use the graph below to describe the distribution of pepperoni counts for the sample of pizzas. 41 49 50 51 52 53 48 47 46 45 Pepperonis on a 24-inch Pizza

Glencoe Algebra 1, Student Edition, 9780079039897, 0079039898, 2018
18th Edition
ISBN:9780079039897
Author:Carter
Publisher:Carter
Chapter10: Statistics
Section10.6: Summarizing Categorical Data
Problem 4DGP

Related questions
Question
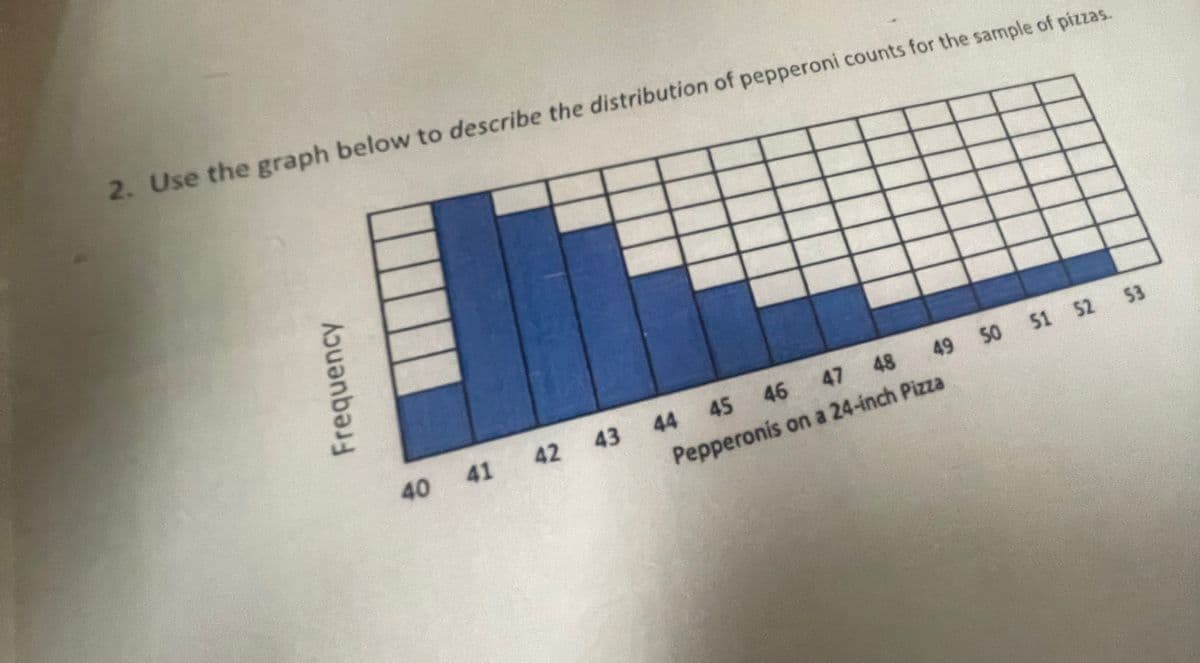
Transcribed Image Text:2. Use the graph below to describe the distribution of pepperoni counts for the sample of pizzas.
Frequency
40 41
42 43
48 49 50 51 52 53
47
46
44 45
Pepperonis on a 24-inch Pizza
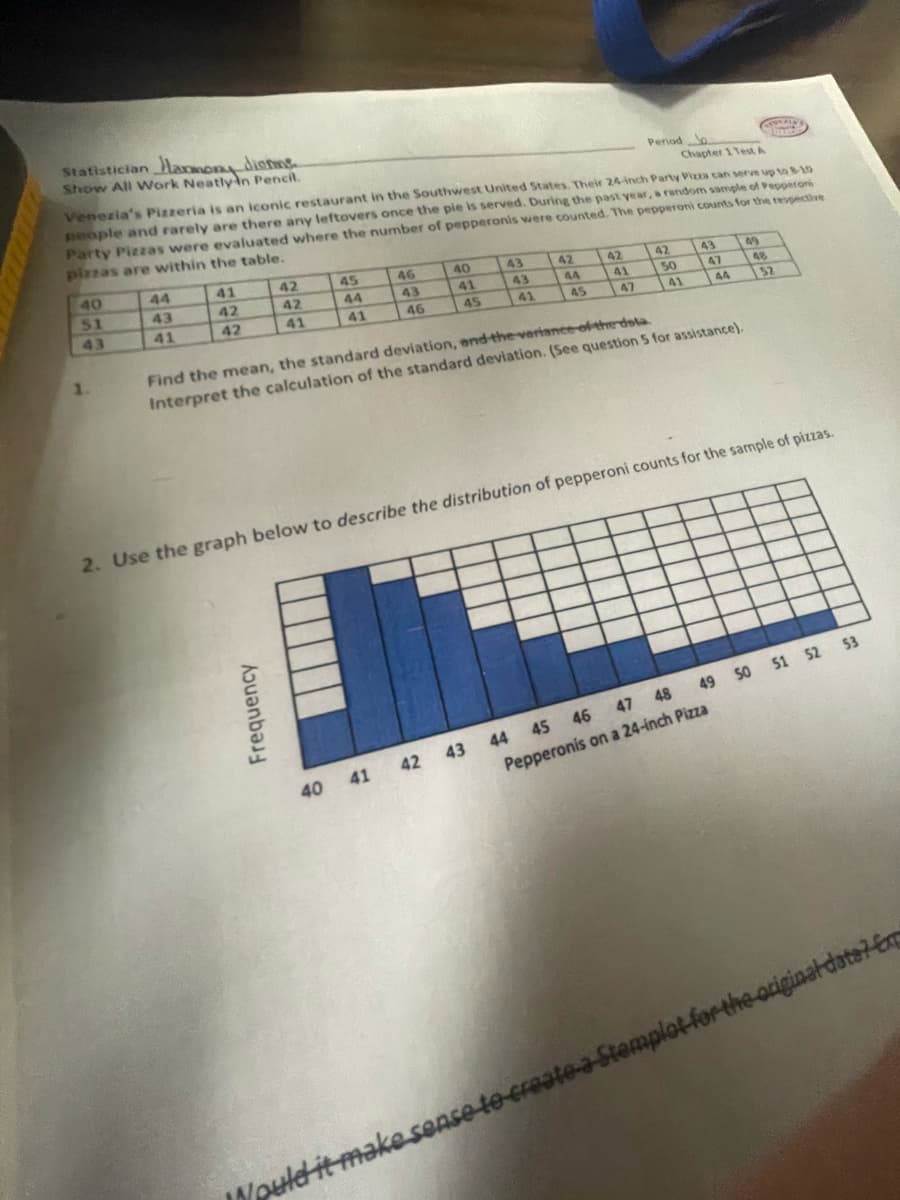
Transcribed Image Text:Statistician Harmon, dienne
Show All Work Neatly in Pencil.
40
51
43
1.
Chapter 1 Test A
Venezia's Pizzeria is an iconic restaurant in the Southwest United States. Their 24-inch Party Pizza can serve up to 8-10
people and rarely are there any leftovers once the pie is served. During the past year, a random sample of Pepperoni
Party Pizzas were evaluated where the number of pepperonis were counted. The pepperoni counts for the respective
pizzas are within the table.
44
43
41
41
42
42
42
42
41
Frequency
45
44
41
46
43
46
40
40 41
41
45
43
43
41
42
44
45
42
41
Period
47
42
50
41
43
47
Find the mean, the standard deviation, and the variance of the deta
Interpret the calculation of the standard deviation. (See question 5 for assistance).
44
Comm
41 42 43 44 45 46 47 48
Pepperonis on a 24-inch Pizza
MENY FAR
49
2. Use the graph below to describe the distribution of pepperoni counts for the sample of pizzas.
48
52
49 50 51 52 53
puld it make sense to create a Stemplat for the originaldate? Er
Expert Solution
This question has been solved!
Explore an expertly crafted, step-by-step solution for a thorough understanding of key concepts.

This is a popular solution!

Trending now
This is a popular solution!

Step by step
Solved in 3 steps with 1 images

Recommended textbooks for you
Glencoe Algebra 1, Student Edition, 9780079039897…
Algebra
ISBN:
9780079039897
Author:
Carter
Publisher:
McGraw Hill
Glencoe Algebra 1, Student Edition, 9780079039897…
Algebra
ISBN:
9780079039897
Author:
Carter
Publisher:
McGraw Hill