4:18 K The data to the right represent the top speed (in kilometers per hour) of all the players (except goaltenders) in a certain soccer league. Construct (a) a relative frequency distribution (b) a frequency histogram, and (c) a relative frequency histogram. What percentage of players had a top speed between 26 and 29.9 km/h? What percentage of players had a top speed less than 13.9 km/h? (a) Construct a relative frequency distribution. Speed (km/hr) Relative Frequency 10-13.9 14-17.9 18-21.9 22-25.9 26-29.9 30-33.9 (Round to four decimal places as needed.) (b) Choose the correct frequency histogram below. OA. C. O A. Frequency C. Frequency 300- 200- 100- 300 200- 100+ 0.6 0.4- 0.2- 18 22 26 30 34 Speed (km/hr) (c) Choose the correct relative frequency histogram below. 0- 10 0.6 0.4- 0.2- 0- 0- 10 14 04 10 10 14 Relative Frequency 18 22 26 30 34 Speed (km/hr) 14 18 22 26 30 Speed (km/hr) Relative Frequency 14 ||| 34 = 18 22 26 30 34 Speed (km/hr) B. D. O OB. D. Frequency Frequency 300- 200- 100- 300 200- 100- 0.6 0.4 0.2- 0.6T 0.4- 0.2- 0- 10 0- 0- 10 10 The percentage of players that had a top speed less than 13.9 km/h was (Round to two decimal places as needed.) V 4G31% LTE2 Speed (km/hr) 10-13.9 14-17.9 18-21.9 22-25.9 26-29.9 30-33.9 14 0- 10 14 18 22 26 Speed (km/hr) 14 Relative Frequency 14 The percentage of players that had a top speed between 26 and 29.9 km/h was (Round to two decimal places as needed.) 18 22 26 Speed (km/hr) Relative Frequency 18 22 26 Speed (km/hr) 18 22 26 Speed (km/hr) %. Number of Players 3 6 14 84 251 173 30 34 30 34 G 30 34 30 34
4:18 K The data to the right represent the top speed (in kilometers per hour) of all the players (except goaltenders) in a certain soccer league. Construct (a) a relative frequency distribution (b) a frequency histogram, and (c) a relative frequency histogram. What percentage of players had a top speed between 26 and 29.9 km/h? What percentage of players had a top speed less than 13.9 km/h? (a) Construct a relative frequency distribution. Speed (km/hr) Relative Frequency 10-13.9 14-17.9 18-21.9 22-25.9 26-29.9 30-33.9 (Round to four decimal places as needed.) (b) Choose the correct frequency histogram below. OA. C. O A. Frequency C. Frequency 300- 200- 100- 300 200- 100+ 0.6 0.4- 0.2- 18 22 26 30 34 Speed (km/hr) (c) Choose the correct relative frequency histogram below. 0- 10 0.6 0.4- 0.2- 0- 0- 10 14 04 10 10 14 Relative Frequency 18 22 26 30 34 Speed (km/hr) 14 18 22 26 30 Speed (km/hr) Relative Frequency 14 ||| 34 = 18 22 26 30 34 Speed (km/hr) B. D. O OB. D. Frequency Frequency 300- 200- 100- 300 200- 100- 0.6 0.4 0.2- 0.6T 0.4- 0.2- 0- 10 0- 0- 10 10 The percentage of players that had a top speed less than 13.9 km/h was (Round to two decimal places as needed.) V 4G31% LTE2 Speed (km/hr) 10-13.9 14-17.9 18-21.9 22-25.9 26-29.9 30-33.9 14 0- 10 14 18 22 26 Speed (km/hr) 14 Relative Frequency 14 The percentage of players that had a top speed between 26 and 29.9 km/h was (Round to two decimal places as needed.) 18 22 26 Speed (km/hr) Relative Frequency 18 22 26 Speed (km/hr) 18 22 26 Speed (km/hr) %. Number of Players 3 6 14 84 251 173 30 34 30 34 G 30 34 30 34

Glencoe Algebra 1, Student Edition, 9780079039897, 0079039898, 2018
18th Edition
ISBN:9780079039897
Author:Carter
Publisher:Carter
Chapter10: Statistics
Section10.4: Distributions Of Data
Problem 19PFA

Related questions
Question
Transcribed Image Text:4:18
K
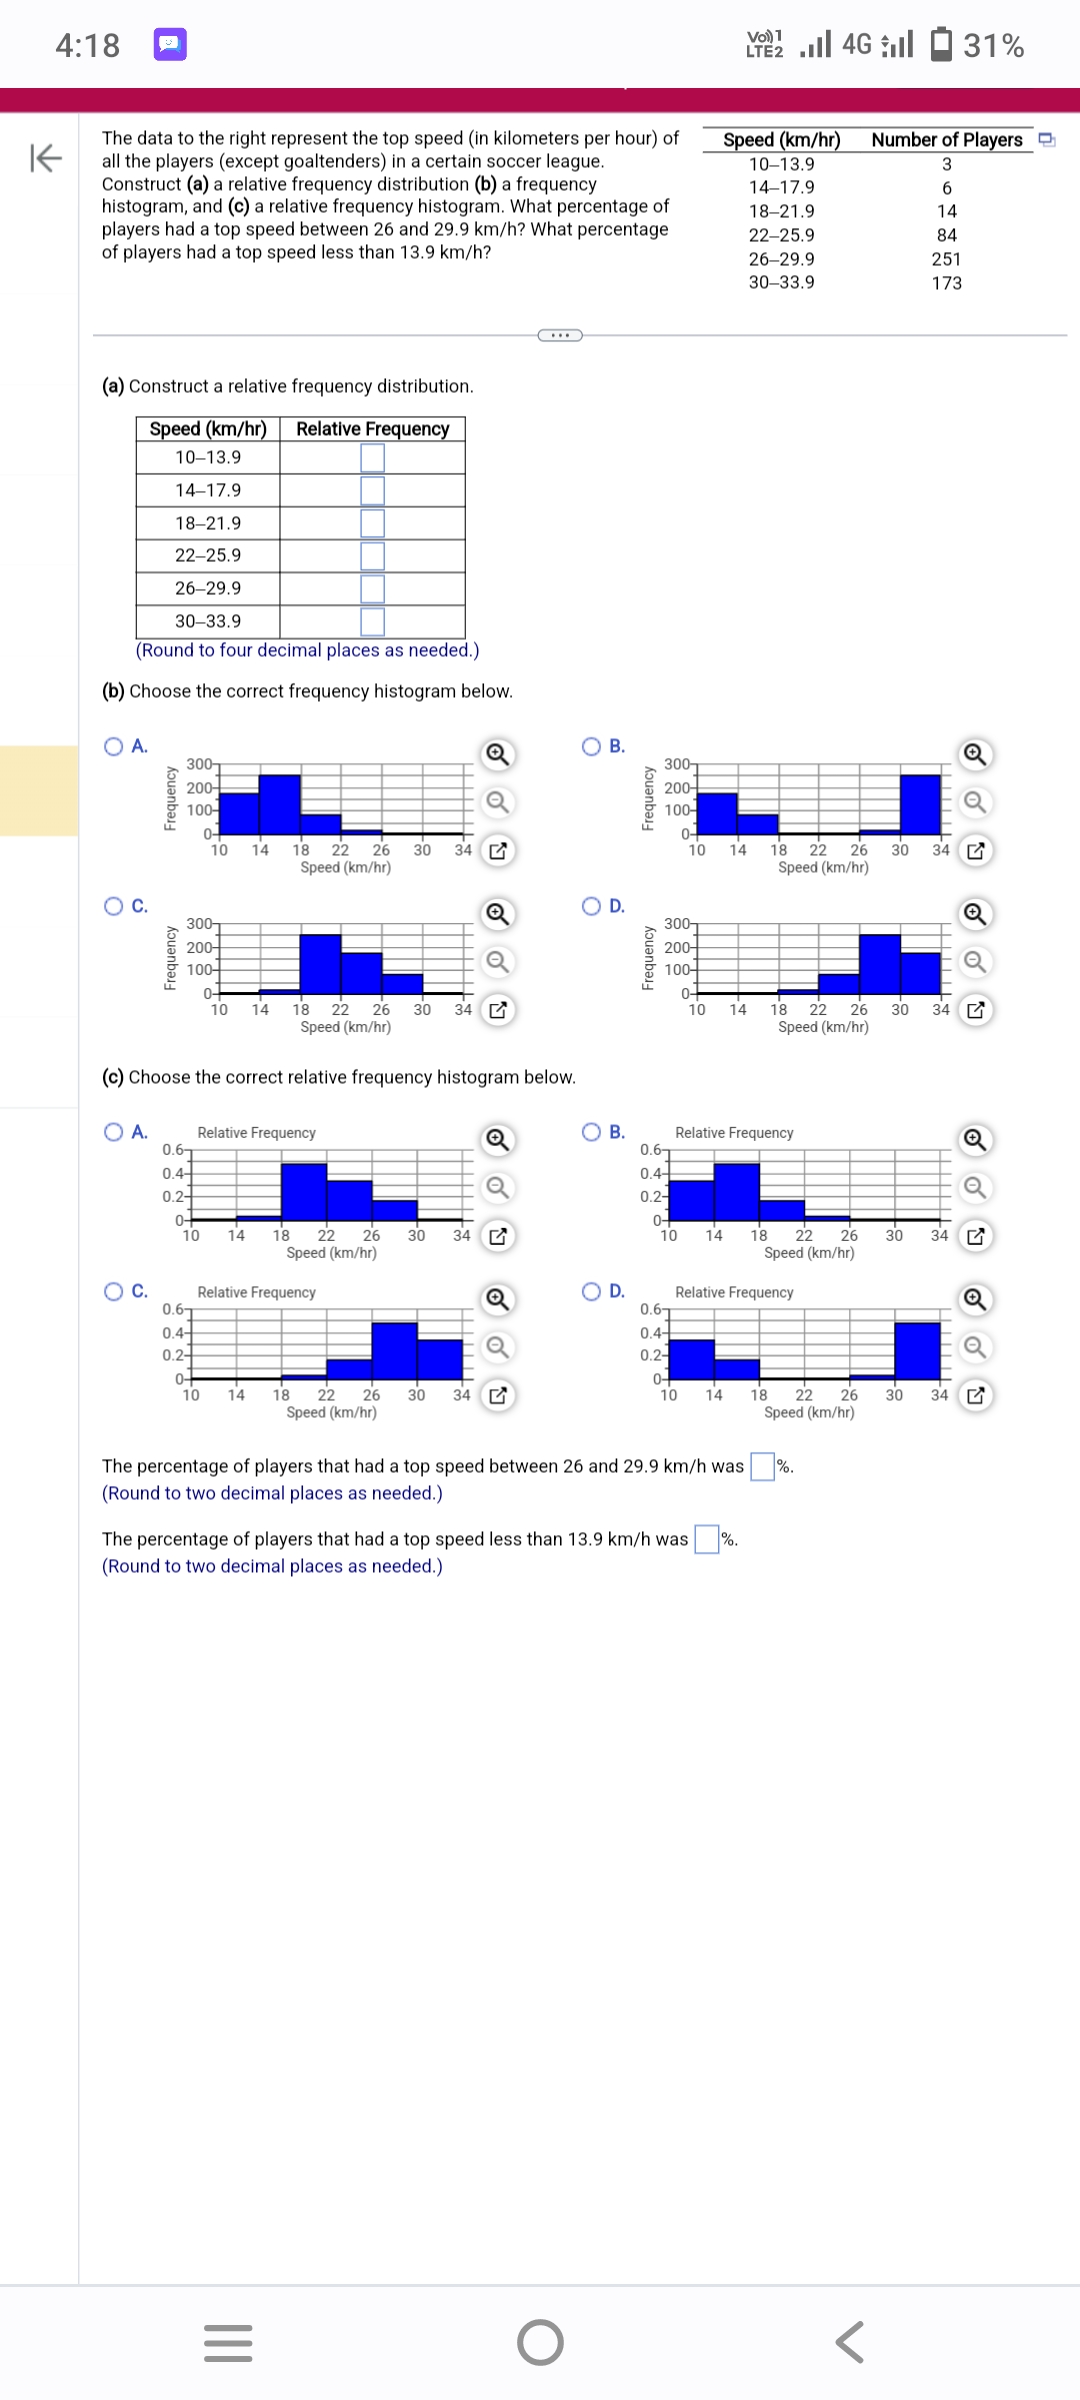
The data to the right represent the top speed (in kilometers per hour) of
all the players (except goaltenders) in a certain soccer league.
Construct (a) a relative frequency distribution (b) a frequency
histogram, and (c) a relative frequency histogram. What percentage of
players had a top speed between 26 and 29.9 km/h? What percentage
of players had a top speed less than 13.9 km/h?
(a) Construct a relative frequency distribution.
Speed (km/hr) Relative Frequency
10-13.9
14-17.9
18-21.9
22-25.9
26-29.9
30-33.9
(Round to four decimal places as needed.)
(b) Choose the correct frequency histogram below.
O A.
C.
O A.
Frequency
C.
Frequency
300-
200-
100-
300
200-
100+
0.6
0.4-
0.2-
18 22 26 30 34
Speed (km/hr)
(c) Choose the correct relative frequency histogram below.
0-
10
0.6
0.4-
0.2-
0-
0-
10 14
0-
10
10 14
Relative Frequency
18 22 26 30 34
Speed (km/hr)
14 18 22 26 30 34
Speed (km/hr)
Relative Frequency
14
|||
18 22 26 30 34
Speed (km/hr)
=
B.
D.
O
OB.
D.
Frequency
Frequency
300-
200-
100-
300
200-
100-
0.6
0.4-
0.2-
0-
10
0-
0-
10
10
The percentage of players that had a top speed less than 13.9 km/h was
(Round to two decimal places as needed.)
V 4G31%
LTE2
Speed (km/hr)
10-13.9
14-17.9
18-21.9
22-25.9
0.6
0.4
0.2-
0-
10 14 18 22 26
Speed (km/hr)
14
14 18 22 26
Speed (km/hr)
14
Relative Frequency
The percentage of players that had a top speed between 26 and 29.9 km/h was
(Round to two decimal places as needed.)
26-29.9
30-33.9
Relative Frequency
18 22 26 30 34
Speed (km/hr)
18 22 26
Speed (km/hr)
Number of Players
3
6
14
84
251
173
%.
30 34
30 34
30 34
Expert Solution
This question has been solved!
Explore an expertly crafted, step-by-step solution for a thorough understanding of key concepts.

This is a popular solution!

Trending now
This is a popular solution!

Step by step
Solved in 2 steps with 2 images

Recommended textbooks for you
Glencoe Algebra 1, Student Edition, 9780079039897…
Algebra
ISBN:
9780079039897
Author:
Carter
Publisher:
McGraw Hill
Glencoe Algebra 1, Student Edition, 9780079039897…
Algebra
ISBN:
9780079039897
Author:
Carter
Publisher:
McGraw Hill