45 40 35 30 25 20 15 10 5 0 2.3 The figure below shows "greater than" ogive graph for a set of data of forty samples of sand. The x-axis represents specific gravity of the samples and the y-axis represents cumulative frequency of samples. The number of samples having S.G. :of 2.55 or more lies between 2.4 "Greater than" Ogive 2.5 2.6 2.7 2.8 2.9
45 40 35 30 25 20 15 10 5 0 2.3 The figure below shows "greater than" ogive graph for a set of data of forty samples of sand. The x-axis represents specific gravity of the samples and the y-axis represents cumulative frequency of samples. The number of samples having S.G. :of 2.55 or more lies between 2.4 "Greater than" Ogive 2.5 2.6 2.7 2.8 2.9

Fundamentals of Geotechnical Engineering (MindTap Course List)
5th Edition
ISBN:9781305635180
Author:Braja M. Das, Nagaratnam Sivakugan
Publisher:Braja M. Das, Nagaratnam Sivakugan
Chapter10: Shear Strength Of Soil
Section: Chapter Questions
Problem 10.24CTP

Related questions

Question
Transcribed Image Text:45
40
35
30
25
20
15
10
5
0
2.3
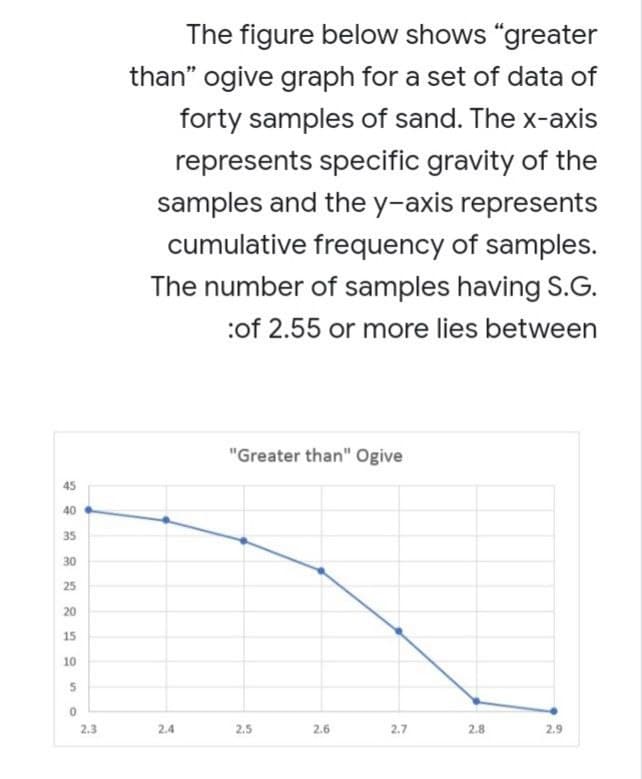
The figure below shows "greater
than" ogive graph for a set of data of
forty samples of sand. The x-axis
represents specific gravity of the
samples and the y-axis represents
cumulative frequency of samples.
The number of samples having S.G.
:of 2.55 or more lies between
2.4
"Greater than" Ogive
2.5
2.6
2.7
2.8
2.9
Expert Solution
This question has been solved!
Explore an expertly crafted, step-by-step solution for a thorough understanding of key concepts.

Step by step
Solved in 2 steps

Knowledge Booster


Learn more about
Need a deep-dive on the concept behind this application? Look no further. Learn more about this topic, civil-engineering and related others by exploring similar questions and additional content below.Recommended textbooks for you
Fundamentals of Geotechnical Engineering (MindTap…
Civil Engineering
ISBN:
9781305635180
Author:
Braja M. Das, Nagaratnam Sivakugan
Publisher:
Cengage Learning
Fundamentals of Geotechnical Engineering (MindTap…
Civil Engineering
ISBN:
9781305635180
Author:
Braja M. Das, Nagaratnam Sivakugan
Publisher:
Cengage Learning