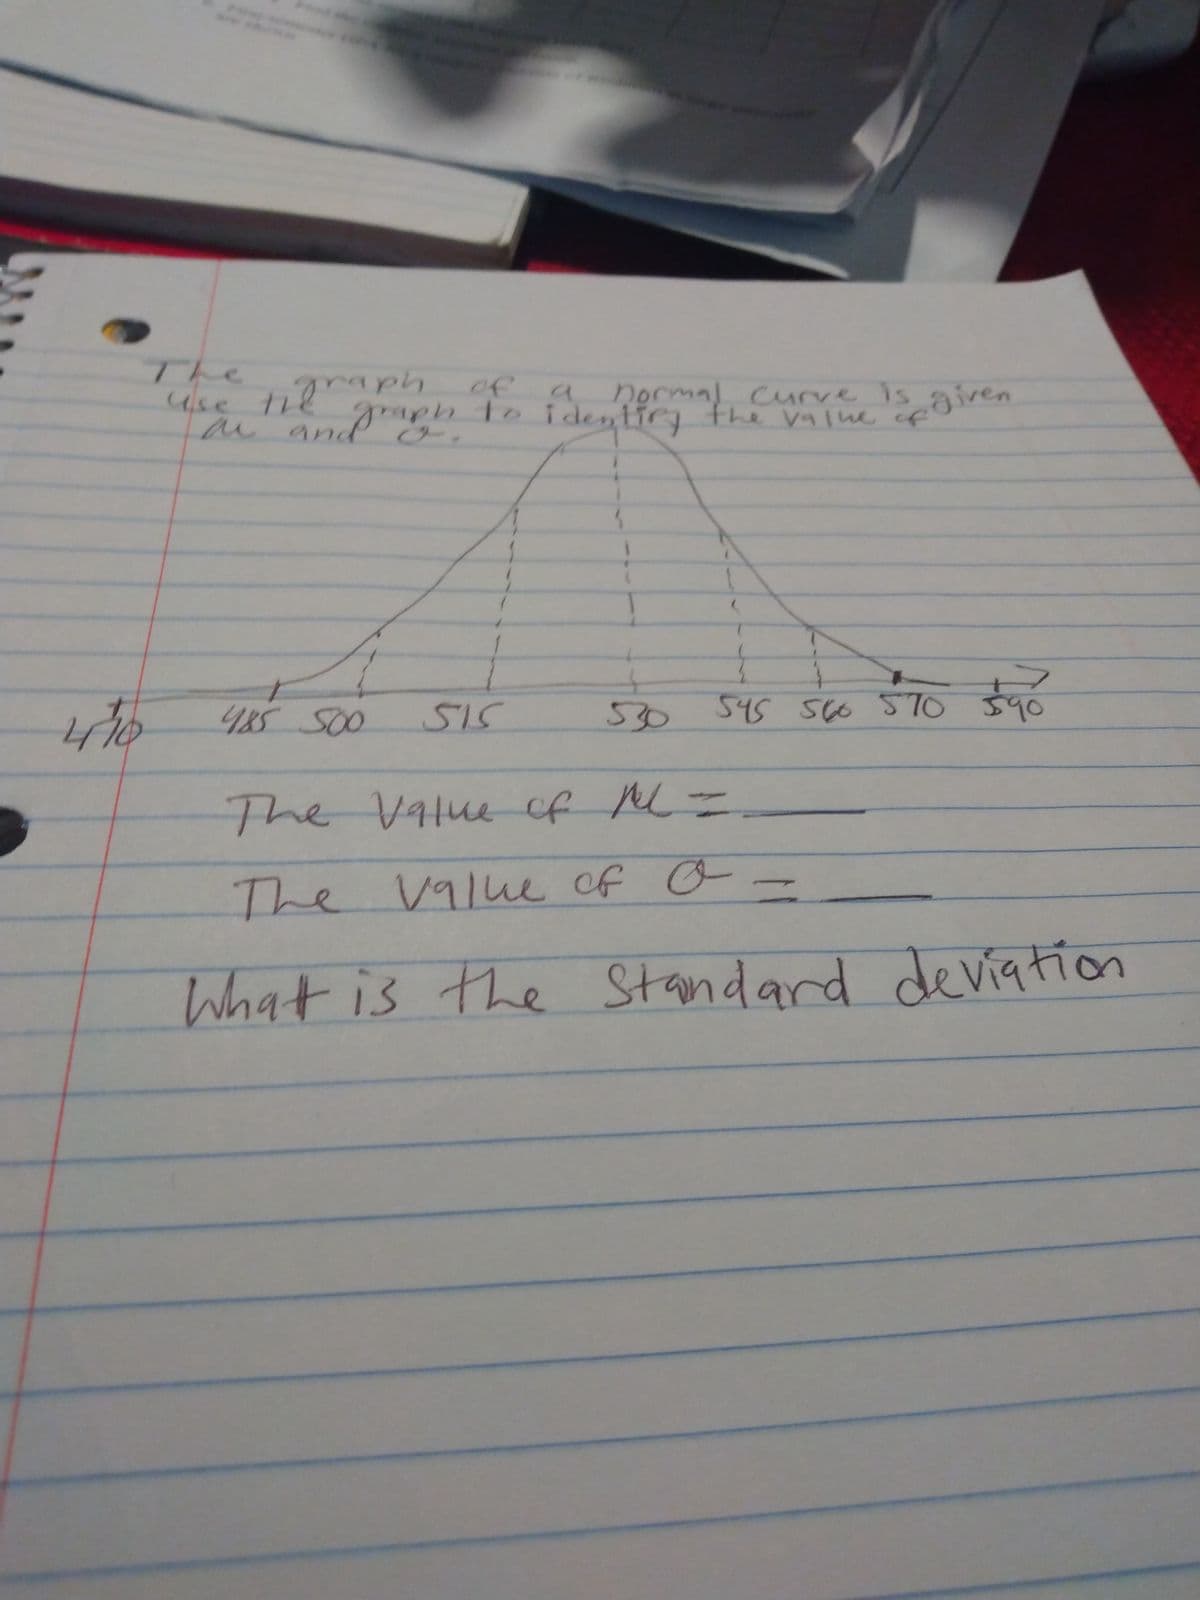
470 of Use tilraph de and graph to identify the value is given 485 500 کاک ( What is the 530 The Value of ML =. The value of O 545 560 570 590 Standard deviation


Q: sample of size n = 34 has sample mean x = 59 and sample standard deviation s = 9.8. Part: 0 / 2 Part…
A:
Q: Research online for similarities and differences between formulas and equations and then compare and…
A: Statistics
Q: You generate a scatter plot using Excel. You then have Excel plot the trend line and report the…
A: We have given that y = 49.18x + 40.52 r2 = 0.5041
Q: Activity 1: Proportion of underno n a random sample of 500 childr Iso there comple data to
A: Given Solution: using minitab>stat>basic stat>one proportion we have
Q: Test the claim below about the mean of the differences for a population of paired data at the level…
A:
Q: 1. As of August 12, 2021, these are the countries with confirmed COVID-19 cases ranging from one to…
A: Measures of central tendency A measure of central tendency (also named as measures of center or…
Q: c) A presidential of staff's club hired a public relations firm to conduct a poll to see whether he…
A: The objective is to test whether Gender is related to how a voter feels about the president.…
Q: oughness experiment with a 23 factorial design in the factors feed rate (A), depth of cut (B), and…
A: Replicates feed rate (A) depth of cut (B) tool angle (C) 1 Low Low Low 9 High Low Low 10…
Q: eh following was collected (4,64) (7,81) (2,50) (9,94) and (4,63). What is teh regression equztion?…
A: Slope and Intercepts are two regression coefficients. Regression explains the relationship between…
Q: Question 9 Assume that a sample is used to estimate a population proportion p. Find the 99%…
A:
Q: 2. Using the measures of dispersion, describe the population of the world's top ten (10) crowded…
A: Given data is City Country Population Tokyo Japan 37,435,191 Delhi India 29,399,141…
Q: 1. Determine the variance of the following 10 sample data: 10,12,9,18, 14,16,14,18,19 and 20
A:
Q: Part C is incorrect, please help! So, that will probably mean parts D and E are also incorrect.
A: In the given problem, a one-proportion z-test was conducted to test the claim whether a drug caused…
Q: Bias from the sampling process (like using a convince sample) is taken into account in interval. If…
A: Given Solution:
Q: Determine the type of direction of correlation that you would expect of the given case / situation.…
A: Correlation shows association between the two numerical variables. If one variable increases then…
Q: Use the applet below to select a random sample of 9 babies from the town. Assume μ = 3,500. Repeat…
A: The objective is to define the most appropriate sequence of sample means of birth weight of 9 babies…
Q: Use the given data to find the equation of the regression line. Examine the scatterplot and identify…
A: Given data: x y 13 17.14 11 16.86 5 7.54 7 12.06 12 17.18 8 13.8 10 16.2 6 9.98…
Q: A political candidate has asked you to conduct a poll to determine what percentage of people support…
A: We know that, Margin of error, E = 3% = 0.03 Confidence level = 98% = 0.98
Q: The test statistic of z = 2.98 is obtained when testing the claim that p=0.543. a. Identify the…
A: GivenTest statistic(z)=2.98claim is p≠0.543
Q: At a university, a dean is going to select 4 volunteers to serve on a committee. There are 11…
A: At university, a dean is going to select 4 volunteers to serve the committee. For this there are 11…
Q: s. Two of these have been given an experimental modification. In the first week after this…
A: Given: Factory has 52 machines.
Q: You wish to test the following claim (H) at a significance level of a = 0.01. H₂:μ = 62.9 Ηα:μ #…
A: Given data , n= 7 M= 70 SD= 13.6 Level of significant / Alpha = 0.01 We have to find out test…
Q: The president of a large university wishes to compare the standard deviation of the ages of students…
A:
Q: The report in LTO stated that the average age of taxis in the Philippines is 12 years. An operations…
A: Given that: Sample size, n = 40 Sample mean, x¯=11.2 Population mean, μ=12 Population standard…
Q: Two random samples were taken from distinct populations. The sample from population one was of size…
A: Given n1=92 n2=69 X1=12 X2=28
Q: On the leeward side of the island of Oahu, in a small village, about 70% of the residents are of…
A: Let p be the probability that a person is of Hawaiian ancestry. Given that p = 0.70 Let N denote the…
Q: If tacomas population in 2000 is 200,000 and it grows by 8% a year, what is the population in 2012?
A: Given: Population in 2000 is 200,000. It grows by 8% a year. Required: To find the population in…
Q: A researcher is studying the average cost of traveling for a college student. As part of their…
A: The sample mean is 1180.
Q: Are America's top chief executive officers (CEOs) really worth all that money? One way to answer…
A: Given: n = 8 Formula Used: Test-statistic t = dsdn
Q: Scores of an IQ test have a bell-shaped distribution with a mean of 100 and a standard deviation of…
A:
Q: (a) Find the probability that a study participant has a height that is less than 65 inches. The…
A: It is given that Mean, μ = 69.3 Standard deviation, σ = 3 Z-Score, Z = ( X - μ )/σ
Q: How many ways can you roll 2 dice so that the sum of the dots is either 7 or 11?
A:
Q: Use the following data to answer the next five questions: Period Demand 1 63 2 68 3 74 4 77 5 62 6…
A: Given data: Period Demand 1 63 2 68 3 74 4 77 5 62 6 69 7 74 8 50
Q: A certain machine produces components having a mean length of 15 cm. As a result of measuring…
A: Given : A test is carried out on a sample to check whether the data on the lengths of the components…
Q: hic transition theory explain population patterns in terms of technological development?
A: Demographical Theory Sociologists' study reveals the population issues have a dependent issues with…
Q: Suppose babies born after a gestation period of 32 to 35 weeks have a mean weight of 2500 grams and…
A: Given Information: 32 to 35 weeks Mean μ=2500 Standard deviation σ=700 40 weeks Mean μ=2700 Standard…
Q: A sample of 10 cam shafts intended for use in gasoline engines has an average eccentricity of 1.02…
A:
Q: with probability in a period independently. • What is the probability that the person ever goes…
A: Given Solution:
Q: Identify the sources of data for the following cases by writing a tick (V) inside the ta Name…
A: Primary data is the data that is directly collected by the researcher for the first time for the…
Q: What is the probability that a computer comes from Factory A? Answer: A computer is selected at…
A: Let us define some events A : a computer comes from factory A. B : a computer comes from factory B.…
Q: Choose the correct terms below: 1. If you increase the confidence level you would expect the…
A: Since you have asked multiple questions, we will solve the first question for you. If you want any…
Q: For students who first enrolled in two-year public institutions in a recent semester, the…
A: Since you have posted a question with multiple sub-parts, we will solve first three subparts for…
Q: Let X₁, X₂,...,Xn be a random sample of size, n from a normal distribution with mean, and variance,…
A:
Q: Ages Number of students 15-18 19-22 23-26 27-30 31-34 35-38 5 2 2 Cumulative Frequency 5 8 5 Based…
A: Given data is Ages Number of students 15-18 5 19-22 2 23-26 2 27-30 5 31-34 8 35-38 5
Q: P is a probability function defined on the power set of a sample space S. Then (i) P() = 0, (ii)…
A:
Q: 1. As of August 12, 2021, these are the countries with confirmed COVID-19 cases ranging from one to…
A:
Q: The data in the following Table 3 represent the number of hours of relief provided by five different…
A: The objective of this problem is to perform the analysis of variance and test the hypothesis at 0.05…
Q: 1 x 12 pdf The probability of a man hitting a target is 1133 (i) If he fires 5 times, what is the…
A:
Q: b) A procurement specialist purchased 28 resistors at random from Supplier 1 and 32 resistors from…
A: It is given that: For Supplier-1:μ1population mean=105σ1population standard deviation=1.58n1 sample…
Q: Here are the scatter plots for two sets of bivariate data with the same response variable. The first…
A: Explanation: Scatter plots have a pattern. An individual data point consider is an outlier if it…

Step by step
Solved in 2 steps
