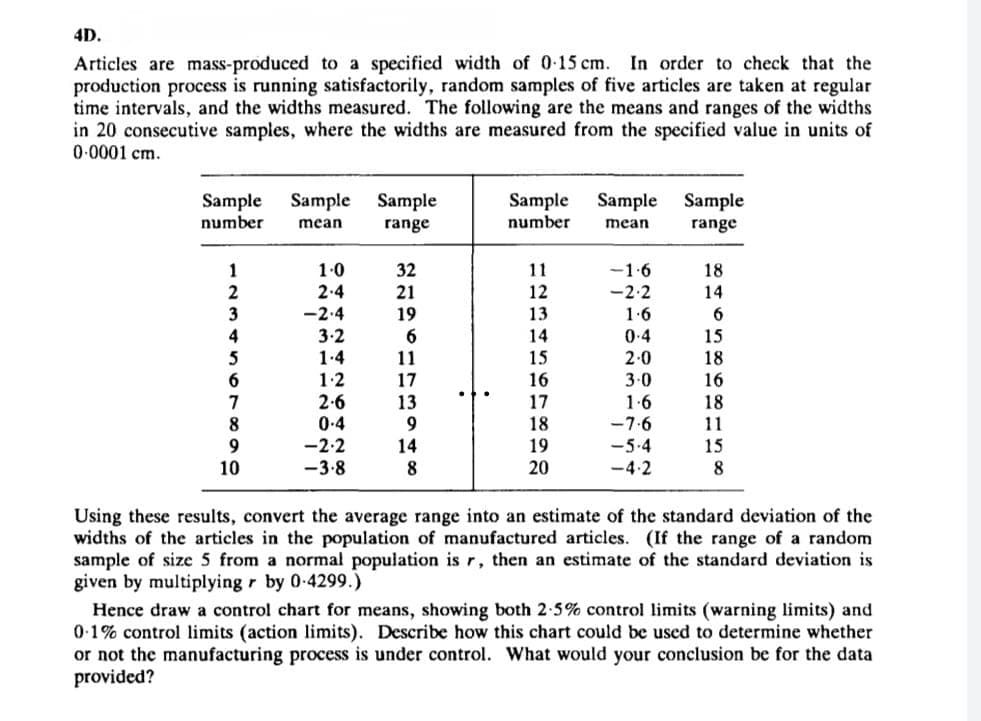
4D. Articles are mass-produced to a specified width of 0-15 cm. In order to check that the production process is running satisfactorily, random samples of five articles are taken at regular time intervals, and the widths measured. The following are the means and ranges of the widths in 20 consecutive samples, where the widths are measured from the specified value in units of 0.0001 cm. Sample Sample Sample number mean range Sample Sample Sample number mean range 1 1-0 32 11 -1.6 18 2 2.4 21 12 -2.2 14 3 -2.4 19 13 1.6 6 4 3.2 6 14 0-4 15 1-4 11 15 2-0 18 6 1.2 17 16 3-0 16 7 2-6 13 17 1-6 18 8 0-4 9 18 -7-6 11 9 -2.2 14 19 <-5-4 15 10 -3.8 8 20 -4-2 8 Using these results, convert the average range into an estimate of the standard deviation of the widths of the articles in the population of manufactured articles. (If the range of a random sample of size 5 from a normal population is r, then an estimate of the standard deviation is given by multiplying r by 0-4299.) Hence draw a control chart for means, showing both 2-5% control limits (warning limits) and 0-1% control limits (action limits). Describe how this chart could be used to determine whether or not the manufacturing process is under control. What would your conclusion be for the data provided?
4D. Articles are mass-produced to a specified width of 0-15 cm. In order to check that the production process is running satisfactorily, random samples of five articles are taken at regular time intervals, and the widths measured. The following are the means and ranges of the widths in 20 consecutive samples, where the widths are measured from the specified value in units of 0.0001 cm. Sample Sample Sample number mean range Sample Sample Sample number mean range 1 1-0 32 11 -1.6 18 2 2.4 21 12 -2.2 14 3 -2.4 19 13 1.6 6 4 3.2 6 14 0-4 15 1-4 11 15 2-0 18 6 1.2 17 16 3-0 16 7 2-6 13 17 1-6 18 8 0-4 9 18 -7-6 11 9 -2.2 14 19 <-5-4 15 10 -3.8 8 20 -4-2 8 Using these results, convert the average range into an estimate of the standard deviation of the widths of the articles in the population of manufactured articles. (If the range of a random sample of size 5 from a normal population is r, then an estimate of the standard deviation is given by multiplying r by 0-4299.) Hence draw a control chart for means, showing both 2-5% control limits (warning limits) and 0-1% control limits (action limits). Describe how this chart could be used to determine whether or not the manufacturing process is under control. What would your conclusion be for the data provided?

Algebra & Trigonometry with Analytic Geometry
13th Edition
ISBN:9781133382119
Author:Swokowski
Publisher:Swokowski
Chapter10: Sequences, Series, And Probability
Section10.8: Probability
Problem 32E

Related questions
Question
Transcribed Image Text:4D.
Articles are mass-produced to a specified width of 0-15 cm. In order to check that the
production process is running satisfactorily, random samples of five articles are taken at regular
time intervals, and the widths measured. The following are the means and ranges of the widths
in 20 consecutive samples, where the widths are measured from the specified value in units of
0.0001 cm.
Sample Sample Sample
number
range
Sample Sample Sample
number
mean
mean
range
1
1.0
32
11
-1.6
18
2
2.4
21
12
-2.2
14
3
-2.4
19
13
1.6
6
4
3.2
6
14
0.4
15
5
1.4
11
15
2.0
18
6
1.2
17
16
3-0
16
7
2.6
13
17
1-6
18
8
0-4
9
18
-7.6
11
9
-2.2
14
19
-5.4
15
10
-3.8
8
20
-4.2
8
Using these results, convert the average range into an estimate of the standard deviation of the
widths of the articles in the population of manufactured articles. (If the range of a random
sample of size 5 from a normal population is r, then an estimate of the standard deviation is
given by multiplying r by 0-4299.)
Hence draw a control chart for means, showing both 2-5% control limits (warning limits) and
0.1% control limits (action limits). Describe how this chart could be used to determine whether
or not the manufacturing process is under control. What would your conclusion be for the data
provided?
Expert Solution
This question has been solved!
Explore an expertly crafted, step-by-step solution for a thorough understanding of key concepts.

Step by step
Solved in 3 steps with 3 images

Recommended textbooks for you
Algebra & Trigonometry with Analytic Geometry
Algebra
ISBN:
9781133382119
Author:
Swokowski
Publisher:
Cengage
Algebra & Trigonometry with Analytic Geometry
Algebra
ISBN:
9781133382119
Author:
Swokowski
Publisher:
Cengage