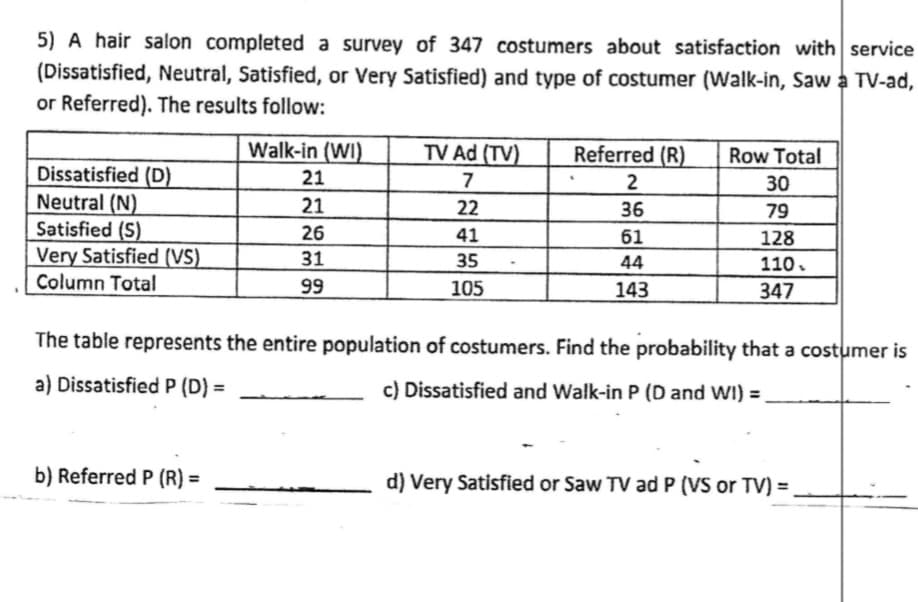
5) A hair salon completed a survey of 347 costumers about satisfaction with service (Dissatisfied, Neutral, Satisfied, or Very Satisfied) and type of costumer (Walk-in, Saw a TV-ad, or Referred). The results follow: Dissatisfied (D) Neutral (N) Satisfied (S) Very Satisfied (VS) Column Total Walk-in (WI) 21 21 26 31 99 b) Referred P (R) = TV Ad (TV) 7 22 41 35 105 Referred (R) 2 36 61 44 143 Row Total 30 79 128 110. 347 The table represents the entire population of costumers. Find the probability that a costumer is a) Dissatisfied P (D) = c) Dissatisfied and Walk-in P (D and WI) = d) Very Satisfied or Saw TV ad P (VS or TV) =


Q: Assume that random guesses are made for six multiple choice questions on an SAT test, so that there…
A: Given: X follows Binomial distribution with parameters n=6 , p=0.6 Binomial probability formula…
Q: Report a 95% confidence interval for the slope coefficient. What is the right limit of the…
A: We need to report the 95% confidence interval for the slope coefficient of given data:- Quantity…
Q: of the histogram. Relative frequency 0.500 0.400 0 300 0.226 Protein 0.151 2.2#6
A: We have given that histogram. We have to check what type of distribution
Q: The admitting office at Sisters of Mercy Hospital wants to be able to inform patients of the average…
A: Given Information: The hypothesized value of population mean μ0=1220. Sample size n=74 Sample mean…
Q: A company is conducting a survey to determine how prepared people are for a long-term power outage,…
A: response Frequency very prepared 266 somewhat prepared 961 not too prepared 586 not at all…
Q: A client of a commercial rose grower has been keeping records on the shelf-life of a rose. The…
A: Class Frequency (f) Mid value (x) fx fx2 1-5 3 3 9 27 6-10 3 8 24 192 11-15 8 13 104 1352…
Q: Large-scale integrated (LSI) circuit chips are made in one department of an electronics firm. These…
A: Given information: The AQL specified by the department is 0.12, and the LTPD acceptable by the…
Q: A researcher wishes to estimate, with 99% confidence, the population proportion of adults who are…
A: Given that, The confidence level is 99% The margin of error E=0.03 The formula for the sample size…
Q: A binomial probability experiment is conducted with the given parameters. Compute the probability of…
A: We have given that n = 20 p = 0.9 x = 18
Q: Jacques has just been notified that the combined principal and interest on an amount he borrowed 19…
A: Compound interest formula : A = P [ 1 + (r/100) ]t Given : A = 2297.78 P = ? r = 8.4 % t = 19…
Q: With a short time remaining in the day, a delivery driver has time to make deliveries at 6 locations…
A: We have given information, A delivery driven has time to make deliveries at 6 locations among the 7…
Q: Given the values of a numeric attribute 112, 117, 117, 119, 120, 125, 125, 125, 127, 128, 130, 134,…
A: Given data is 112,117,117,119,120,125,125,125,127,128,130,134,135,135,135,147,160,163,167,170sample…
Q: Part D please
A: Here X has normal distribution with mean of 75847 and standard deviation of 33800 We have to find…
Q: Exercise 06.27 Algo (Exponential Probability Distribution) Consider the following exponential…
A:
Q: Topic: CENTRALIZATION AND DISPERSION MEASURES GROUPED DATA The following table shows the pulses…
A: Given information: The data for the pulse rates of women and men are given. First creat table :…
Q: 10) Find the probability P(Z > 1.28) and provide a graph showing your result.
A: The probability that Z > 1.28 is under the curve.
Q: For each of the time series models below undertake the following steps: Write each time series in…
A: Given that Yt-14-2Yt-1=2εt+εt-1-1-B2εt we have to write the characteristic…
Q: The life time, in years, of some electronic component is a continuous variable with the density f(x)…
A: From given data we have : f(x)=kx7x≥10x<1
Q: Let c be a constant and consider the density function for the random variable Y a. Find the value…
A: Here the given information is Let c be a constant and consider the density function for the random…
Q: a) One-way ANOVA is equivalent to two-sample t-test when number of groups k = 2. b) For two-sample…
A: State whether the following statements are true or false.
Q: A classic counting problem is to determine the number of different ways that the letters of…
A: According to the given information in this question We need to find the different ways that the…
Q: 4. What is the standard deviation of demand during the lead time? If the standard deviation for the…
A: The standard deviation of demand during lead time can be defined as the product of standard…
Q: The alkalinity level of water specimens collected from the Han River in Seoul, Korea, has a mean of…
A: given data normal distribution μ = 50σ = 3.2
Q: 7. Simon's lawnmower has a probability of 0.3 of starting any time he pulls the starter cord. Which…
A: From the provided information, let X be the event that Simon’s lawnmower starts any time he pulls…
Q: A study was done looking at cancer rates near a large factory. The researchers collected data for…
A: Given that A study was done looking at cancer rates near a large factory. The researchers collected…
Q: When applied to the same dataset, which of the following error bars would have the smallest range of…
A: 95% confidence interval : (95% data included in sample) It means that there is only 5 % chance that…
Q: A sandwich shop claims to sell sub sandwiches that are 12 inches lona. An employee is a little…
A: We have given information, μ=12 inches n=45 x¯=12 inches s= 18 inches
Q: Assume that when adults with smartphones are randomly selected, 63% use them in meetings or classes.…
A: Givenprobability of adults use smartphones in meetings or classes(p)=0.63sample size(n)=8Let "x"be…
Q: 2. Suppose you take a bag of M&M's from problem 1, and group them by colors. The distribution of…
A: Given, Total no.of colors=53
Q: A clinical cancer center follows up with patients in three age groups to investigate the occurrence…
A: The question is about categorical data analysis Given : To find : Test the null hypo. that age…
Q: The distance (in kilometers) and price (in dollars) for one-way airline tickets from San Francisco…
A: Given Information: The data for Distance and price for one-way airline tickets are given.
Q: Below is a list of exam scores for 10 statistics students. 74 72 80 63 72 68 72 56 85 96 What is the…
A: Given data is,74, 72, 80, 63, 72, 68, 72, 56, 85, 96Arrange the given data in ascending order56, 63…
Q: 12. A drug manufacturer claims that less than 10% of patients who take its new drug for treating…
A: In this question, we will discuss the Type I and Type II errors associated with a drug…
Q: A state policeman has a pet theory that people who drive red cars are more likely to drive too fast.…
A: Given that: For red cars: n1=28x1=18 For other cars: n2=205x2=75
Q: Consider the following table. Amount of Life Insurance on Wife (thousands of $) 0-50 50-100 100-150…
A: Given data: Amount of life insurance on Husband 0-50 50-100 100-150 more than…
Q: Find the probability of each of the following, if Z~N(μ = 0,σ = 1). (please round any numerical…
A: Let X be the random variable from standard normal distribution with mean (μ) = 0 and standard…
Q: Suppose you play a game of chance in which five numbers are chosen from 0, 1, 2, 3, 4, 5, 6, 7, 8,…
A: Given 5 no. are chosen from 0, 1, 2, 3, 4, 5, 6, 7, 8, 9 and $2 is payed to play. One could profit…
Q: A bottling machine is operating with a standard deviation of 0.1 ounces. Suppose that in a simple…
A: Given,sample size(n)=43sample mean(x¯)=16.11population standard deviation(σ)=0.1
Q: The 2010 General Social Survey asked the question: "For how many days during the past 30 days was…
A: In statistical inference an investigator wants to know about the population parameters. But for…
Q: K With a short time remaining in the day, a delivery driver has time to make deliveries at 4…
A: Given that A delivery driver has to make deliveries at 4 locations among 8 locations remaining....…
Q: Use the frequency histogram to complete the following parts. (a) Determine the number of classes.…
A: Given :
Q: A population of values has a normal distribution with μ=154.9 and σ=69.8. You intend to draw a…
A: From the provided information, Mean (µ) = 154.9 Standard deviation (σ) = 69.8 Sample size (n) = 196
Q: Which of the following is the estimated regression line?
A: The model contains one dependent (Y) and one independent variable (X). The ANOVA output with the…
Q: If P(E)=0.50, P(E or F) = 0.60, and P(E and F) = 0.15, find P(F). P(F)= (Simplify your answer.)
A: given data, p(E)=0.50p(E or f)=0.60p(E and F)=0.15p(F)=?
Q: How do I calculate the following for relative error by hand? I'm aware that the formula is RE = abs…
A: To calculate the relative error without using a calculator, you can use the following steps: Step 1:…
Q: (v) Apply the change of variable v = · ( ¹ + ² ) u + u to get that fr(t) = constant x (¹ + ²/² )¯
A: In this exercise, we will derive the PDF of the t-distribution with k degrees of freedom, T, given…
Q: Regarding the question above please answer 4 and 5. Thank you
A: Given that, Universal set U={1, 2, 3, 4, 5, 6, 7, 8, 9, 10, 11, 12} , Set A ={1, 2, 3, 4, 5, 6, 7,…
Q: What is the second term in each row of Pascal's triangle? 2 0 equal to the row number 1
A: Sol:-
Q: 19. A lot contains 1% defective items. What should be the number of items in a lot so that the…
A:
Q: 11. The National Oceanic and Atmospheric Administration tracks the amount of oysters harvested from…
A: This question examines the amount of oysters harvested from the Chesapeake Bay each year since 1900.…


Trending now
This is a popular solution!

Step by step
Solved in 5 steps with 4 images

- Suppose the probability of erroneously transmitting a single digit is P=0.03. Compute the probability of transmitting a 4-bit code word with (a) at most one error, and (b) exactly four errors.In a study of high school students at least 16 years of age, researchers obtained the survey results summarized in the table below (based on data from “Texting While Driving and Other Risk Motor Vehicle Behaviors Among U.S. High School Students” by O’Malley, Shults, and Eaton, Pediatrics, 131, No.6). Irregular Seat Belt Use? Yes No RT Texted While Driving 1737 2048 3785 Did not Text While Driving 1945 2775 4720 Column total 3682 4823 8505 State the null and alternative hypotheses. Null hypothesis: H0 Texting when driving is independent of irregular seat belt use. Alternative hypothesis: Texting when driving is dependent of irregular seat belt use. Assuming independence, what are the expected frequencies for each of these variables? E=(row total)(column total) (grand total) What is the value of the X2 statistic? X2=E(0-E)2…The U.S. Census Bureau conducts annual surveys to obtain information on the percentage of the voting-age population that is registered to vote. Suppose that 642642 employed persons and 745745 unemployed persons are independently and randomly selected, and that 376376 of the employed persons and 300300 of the unemployed persons have registered to vote. Can we conclude that the percentage of employed workers ( p1p1 ), who have registered to vote, exceeds the percentage of unemployed workers ( p2p2 ), who have registered to vote? Use a significance level of α=0.1α=0.1 for the test. Step 1 of 6: State the null and alternative hypotheses for the test. Step 2 of 6: Find the values of the two sample proportions, pˆ1p^1 and pˆ2p^2. Round your answers to three decimal places. Step 3 of 6: Compute the weighted estimate of p, p‾‾p‾. Round your answer to three decimal places. Step 4 of 6: Compute the value of the test statistic. Round your answer to two decimal places. Step 5 of 6: Determine…
- A study was performed concerning medical emergencies on commercial airline flights. A database was constructed based on calls to a medical communications center from 5 domestic and international airlines representing approximately 15% of the global passenger flight volume from January 2005 to December 2007. There were 11,000 in flight medical emergencies (IFM) among 8,000,000 flights during the study period. Assume that there is at most 1 IFM per flight. Suppose a flight attendant works on 3 flights per day for each of 300 days per year. Also, assume that the flight attendant’s total duration of employment is 20 years. What is the approximate probability that he/she encounter at least 5 IFM’s over a 20 year period? (b) Suppose we observe 80 alcoholics with cirrhosis of the liver, of whom 25 have hepatomas, that is, liver cell carcinoma. Suppose we know, based on a large sample, that t`he risk of hepatoma among alcoholics without cirrhosis of the liver is 25%. What is the approximate…The Higher Education Research Institute at UCLA collected data from 203,967203,967 incoming first-time, full-time freshmen from 270270 four-year colleges and universities in the U.S. 67.4%67.4% of those students replied that, yes, they believe that same-sex couples should have the right to legal marital status. Suppose that you randomly pick eight first-time, full-time freshmen from the survey. You are interested in the number that believes that same sex-couples should have the right to legal marital status. Let the random variable X=X= the number that reply "yes", X∼B(8,0.674)X∼B8,0.674. (a) Construct the probability distribution function (PDF).Round your answers to four decimal places. xx P(x)Px 00 11 22 33 44 55 66 77 88 (b) On average (μμ), how many would you expect to answer yes?Round your answer to two decimal places.μ=μ= (c) What is the standard deviation (σσ)?Round your answer to two decimal places.σ=σ=3.) An advertising agency wants to know whether the no of column inches of classified ad carried by 2 competing newspapers is equal. The no of column inches appearing in both newspapers, respectively, on 20 randomly selected days follows: 663 & 725, 713 & 806, 626 & 620, 682 & 626, 639 & 595, 651 & 614, 769 & 744, 701 & 719, 723 & 680, 670 & 639, 665 & 602, 639 & 657, 694 & 624, 614 & 614, 651 & 583, 632 & 682, 739 & 657, 657 & 639 & 775 & 745. a.) Use signed-rank test at 0.01 level of sig to test to test whether or not newspaper 1 & 2 carry equal amount of classified ad. b.) A random sample of orders at an auto supply warehouse took 27, 41, 33, 44, 34, 22, 38, 23, 30, 37 & 32 minutes to assemble for shipment. Use the signed rank test at 0.05 level of sig to test whether or not it takes, on the average, 29 minutes to assemble an order for shipment.
- A study showed that 64% of supermarket shoppers believe supermarket brands to be as good as national name brands. To investigate whether this result applies to its own product, the manufacturer of a national name-brand ketchup asked a sample of shoppers whether they believed that supermarket ketchup was as good as the national brand ketchup. Only BA manufacturing company that produces laminate for countertops is interested in studying the relationship between the number of hours of training that an employee receives and the number of defects per countertop produced. Ten employees are randomly selected. The number of hours of training each employee has received is recorded and the number of defects on the most recent countertop produced is determined. The results are as follows. Hours of Training Defects per Countertop 1 5 4 1 7 0 3 3 2 5 2 4 5 1 5 2 1 8 6 2 Copy Data The estimated regression line and the standard error are given. Defects per Countertop=6.717822−1.004950(Hours of Training)se=1.229787se=1.229787 Suppose a new employee has had 5 hours of training. What would be the 90% prediction interval for the number of defects per countertop? Round your answer to two decimal places.The U.S. Census Bureau conducts annual surveys to obtain information on the percentage of the voting-age population that is registered to vote. Suppose that 450450 employed persons and 477477 unemployed persons are independently and randomly selected, and that 291291 of the employed persons and 242242 of the unemployed persons have registered to vote. Can we conclude that the percentage of employed workers ( p1p1 ), who have registered to vote, exceeds the percentage of unemployed workers ( p2p2 ), who have registered to vote? Use a significance level of α=0.05α=0.05 for the test. Step 3 of 6 : Compute the weighted estimate of p, p‾‾p‾. Round your answer to three decimal places. Please do steps 3-6
- The U.S. Census Bureau conducts annual surveys to obtain information on the percentage of the voting-age population that is registered to vote. Suppose that 450450 employed persons and 477477 unemployed persons are independently and randomly selected, and that 291291 of the employed persons and 242242 of the unemployed persons have registered to vote. Can we conclude that the percentage of employed workers ( p1p1 ), who have registered to vote, exceeds the percentage of unemployed workers ( p2p2 ), who have registered to vote? Use a significance level of α=0.05α=0.05 for the test. Step 2 of 6 : Find the values of the two sample proportions, pˆ1p^1 and pˆ2p^2. Round your answers to three decimal places. I NEED ALL OF THE STEPS PLEASETo investigate whether it helps to have a "white-sounding" first name when looking for a job, the researchers sent 5,000 resumes in response to ads that appeared in magazines. The resumes were identical except that 2,500 of them had "white-sounding" first names, such as Brett and Emily, whereas the other 2,500 had "black-sounding" names such as Tamika and Rasheed. Resumes of the first type elicited 251 responses and resumes of the second type only 169 responses. A button hyperlink to the SALT program that reads: Use SALT. Do these data support the theory that the proportion receiving responses is greater for those resumes with "white-sounding first" names? (Use ? = 0.05. Use pwhite-sounding − pblack-sounding.) Find the test statistic. (Round your answer to two decimal places.) z = Find the P-value. (Round your answer to four decimal places.) P-value = State your conclusion. Reject H0. We have convincing evidence that the proportion eliciting responses is higher for…The article “A ‘White’ Name Found to Help in Job Search” (AP, 1/15/03) described an experiment to investigate if it helps to have a white-sounding first name when looking for a job. Researchers sent 5000 resumes in response to ads that appeared in the Boston Globe and Chicago Tribune. The resumes were identical except the 2500 of them had “white-sounding” first names, such as Brett and Emily, whereas the other 2500 had “black-sounding” names such as Tamika and Rasheed. Resumes of the first type elicited 300 responses and resumes of the second type only 167 responses. Does this data support the theory that the proportion receiving positive responses is higher by more than 10% for those resumes with “white-sounding” first names? Use a significance level of .05.
