5 At t = 0 s, a particle is at position x = -2 m. Its velocity for t > 0 is shown in the graph below. The motion is one-dimensional. A) What is the particle's position att = 8 s? As always, show your work. If you see a quick way to answer this question, take it! Just explain your reasoning. B) Calculate the particle's acceleration at t = 10.5 s. Is the particle speeding up or slowing down at this time? v (m/s) 5.0 8.0 t (s) 1.0 3.0 4.0 6.0 9.0 11.0
5 At t = 0 s, a particle is at position x = -2 m. Its velocity for t > 0 is shown in the graph below. The motion is one-dimensional. A) What is the particle's position att = 8 s? As always, show your work. If you see a quick way to answer this question, take it! Just explain your reasoning. B) Calculate the particle's acceleration at t = 10.5 s. Is the particle speeding up or slowing down at this time? v (m/s) 5.0 8.0 t (s) 1.0 3.0 4.0 6.0 9.0 11.0

Glencoe Physics: Principles and Problems, Student Edition
1st Edition
ISBN:9780078807213
Author:Paul W. Zitzewitz
Publisher:Paul W. Zitzewitz
Chapter3: Accelerated Motion
Section3.1: Acceleration
Problem 2PP

Related questions
Question
5 please show work
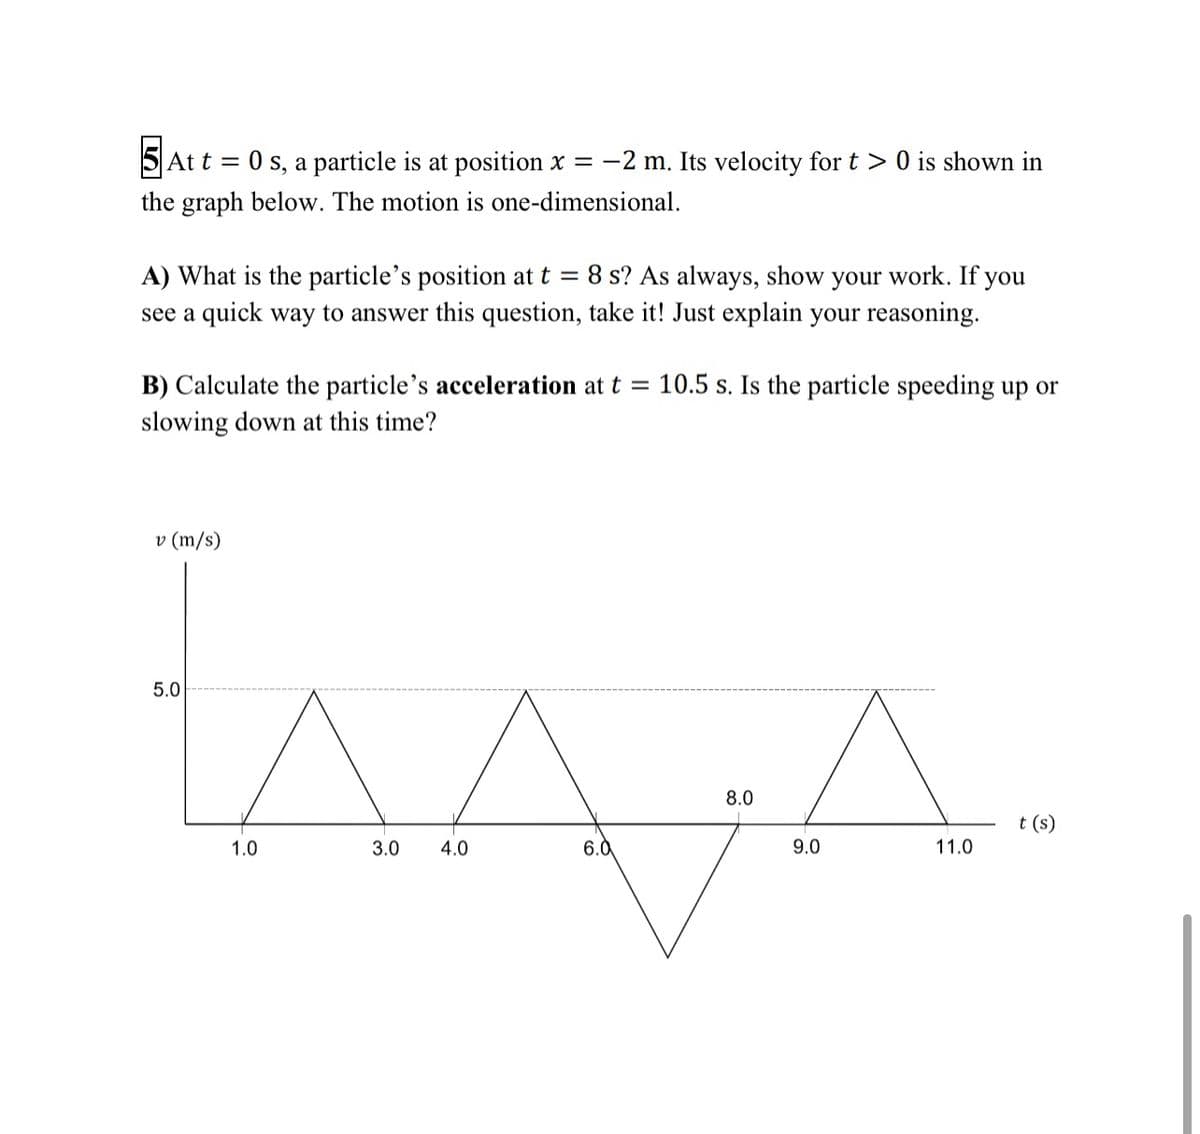
Transcribed Image Text:5 At t = 0 s, a particle is at position x = -2 m. Its velocity fort > 0 is shown in
the graph below. The motion is one-dimensional.
A) What is the particle's position at t = 8 s? As always, show your work. If you
see a quick way to answer this question, take it! Just explain your reasoning.
B) Calculate the particle's acceleration at t = 10.5 s. Is the particle speeding up or
slowing down at this time?
v (m/s)
5.0
8.0
t (s)
1.0
3.0
4.0
6.0
9.0
11.0
Expert Solution
This question has been solved!
Explore an expertly crafted, step-by-step solution for a thorough understanding of key concepts.

Step by step
Solved in 2 steps

Recommended textbooks for you
Glencoe Physics: Principles and Problems, Student…
Physics
ISBN:
9780078807213
Author:
Paul W. Zitzewitz
Publisher:
Glencoe/McGraw-Hill
Glencoe Physics: Principles and Problems, Student…
Physics
ISBN:
9780078807213
Author:
Paul W. Zitzewitz
Publisher:
Glencoe/McGraw-Hill