5) Determine and plot the real continuous-time signal x(t) if its magnitude and phase spectra are as shown in Figure 2: |X(w)| LX(w) 2 w(rad/s) Figure 2 sa Slope - 2 w(rad/s) Ans:[30-(1-4)]]
5) Determine and plot the real continuous-time signal x(t) if its magnitude and phase spectra are as shown in Figure 2: |X(w)| LX(w) 2 w(rad/s) Figure 2 sa Slope - 2 w(rad/s) Ans:[30-(1-4)]]

Delmar's Standard Textbook Of Electricity
7th Edition
ISBN:9781337900348
Author:Stephen L. Herman
Publisher:Stephen L. Herman
Chapter17: Resistive-inductive Series Circuits
Section: Chapter Questions
Problem 2PP: Assume that the voltage drop across the resistor, ER, is 78 V, that the voltage drop across the...

Related questions
Question
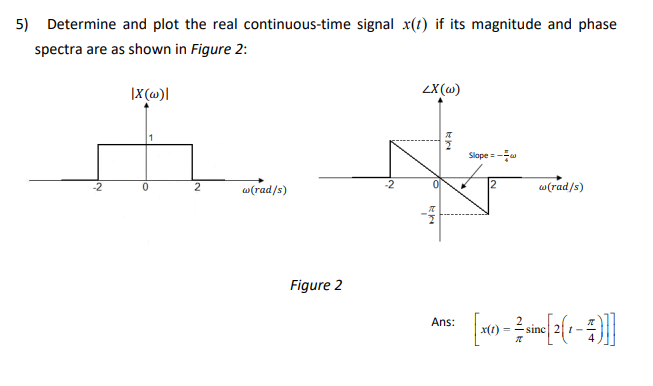
Transcribed Image Text:5) Determine and plot the real continuous-time signal x(t) if its magnitude and phase
spectra are as shown in Figure 2:
|X(w)|
ZX(w)
-2
0
2
w(rad/s)
Figure 2
-2
K2
Slope=
2
w(rad/s)
Ans:
A:[-(1-4)
sinc
Expert Solution
This question has been solved!
Explore an expertly crafted, step-by-step solution for a thorough understanding of key concepts.

Step by step
Solved in 3 steps with 7 images

Knowledge Booster


Learn more about
Need a deep-dive on the concept behind this application? Look no further. Learn more about this topic, electrical-engineering and related others by exploring similar questions and additional content below.Recommended textbooks for you
Delmar's Standard Textbook Of Electricity
Electrical Engineering
ISBN:
9781337900348
Author:
Stephen L. Herman
Publisher:
Cengage Learning
Delmar's Standard Textbook Of Electricity
Electrical Engineering
ISBN:
9781337900348
Author:
Stephen L. Herman
Publisher:
Cengage Learning