5. In the film, Dr. Jablonski explains that melanin, located in the top layer of human skin, absorbs UV radiation, protecting cells from the damaging effects of UV. Genetics determines the type of melanin (i.e., brown/black eumelanin or red/brown pheomelanin) and the amount of melanin present in an individual’s cells. Based on this information, write a hypothesis for where in the world you would expect to find human populations with darker or lighter skin pigmentation (i.e., different amounts of melanin).
5. In the film, Dr. Jablonski explains that melanin, located in the top layer of human skin, absorbs UV radiation, protecting cells from the damaging effects of UV. Genetics determines the type of melanin (i.e., brown/black eumelanin or red/brown pheomelanin) and the amount of melanin present in an individual’s cells. Based on this information, write a hypothesis for where in the world you would expect to find human populations with darker or lighter skin pigmentation (i.e., different amounts of melanin).

Case Studies In Health Information Management
3rd Edition
ISBN:9781337676908
Author:SCHNERING
Publisher:SCHNERING
Chapter6: Leadership
Section: Chapter Questions
Problem 6.21.3C

Related questions

Concept explainers
Question
100%
Can you please help me with questions
5. In the film, Dr. Jablonski explains that melanin, located in the top layer of human skin, absorbs UV radiation, protecting cells from the damaging effects of UV. Genetics determines the type of melanin (i.e., brown/black eumelanin or red/brown pheomelanin) and the amount of melanin present in an individual’s cells. Based on this information, write a hypothesis for where in the world you would expect to find human populations with darker or lighter skin pigmentation (i.e., different amounts of melanin).
9. Do these data support your hypothesis from Question 5? Justify your answer.
Transcribed Image Text:SKIN.
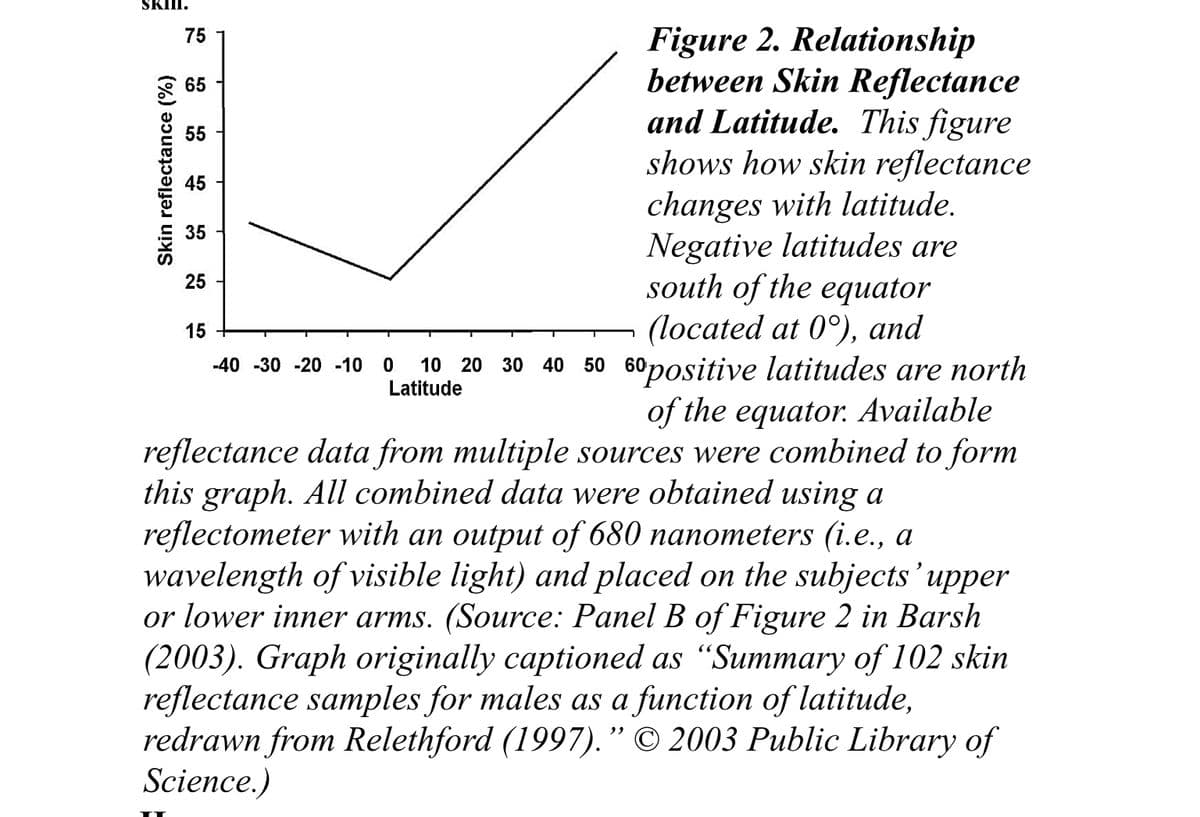
Figure 2. Relationship
between Skin Reflectance
and Latitude. This figure
shows how skin reflectance
changes with latitude.
Negative latitudes are
south of the equator
(lосated at 0°), and
10 20 30 40 50 60positive latitudes are north
of the equator. Available
reflectance data from multiple sources were combined to form
75
65
55
45
25
15
-40 -30 -20 -10 0
Latitude
this graph. All combined data were obtained using a
reflectometer with an output of 680 nanometers (i.e., a
wavelength of visible light) and placed on the subjects'upper
or lower inner arms. (Source: Panel B of Figure 2 in Barsh
(2003). Graph originally captioned as “Summary of 102 skin
reflectance samples for males as a function of latitude,
redrawn from Relethford (1997). " © 2003 Public Library of
Science.)
Skin reflectance (%)
Transcribed Image Text:-120
-60
60
120
-120
-60
60
120
2
4
6
10
12
14
16
18
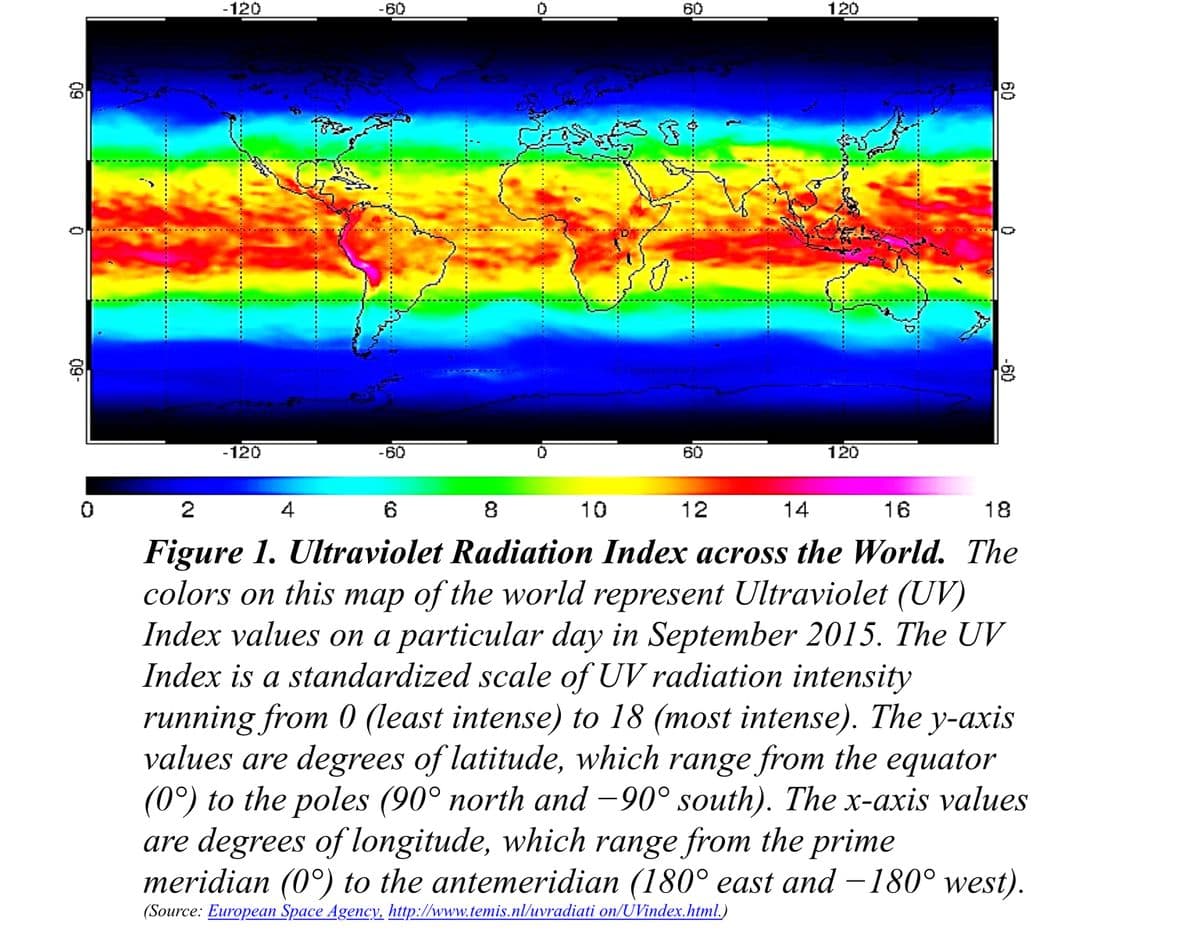
Figure 1. Ultraviolet Radiation Index across the World. The
colors on this map of the world represent Ultraviolet (UV)
Index values on a particular day in September 2015. The UV
Index is a standardized scale of UV radiation intensity
running from 0 (least intense) to 18 (most intense). The y-axis
values are degrees of latitude, which range from the equator
(0°) to the poles (90° north and -90° south). The x-axis values
are degrees of longitude, which range from the prime
meridian (0°) to the antemeridian (180° east and –180° west).
(Source: European Space Agency, http://www.temis.nl/uvradiati on/UVindex.html.)
60
-60
.....:....
---..
09
09-
Expert Solution
This question has been solved!
Explore an expertly crafted, step-by-step solution for a thorough understanding of key concepts.

This is a popular solution!

Trending now
This is a popular solution!

Step by step
Solved in 2 steps

Knowledge Booster


Learn more about
Need a deep-dive on the concept behind this application? Look no further. Learn more about this topic, biology and related others by exploring similar questions and additional content below.Recommended textbooks for you
Case Studies In Health Information Management
Biology
ISBN:
9781337676908
Author:
SCHNERING
Publisher:
Cengage
Case Studies In Health Information Management
Biology
ISBN:
9781337676908
Author:
SCHNERING
Publisher:
Cengage

Principles Of Radiographic Imaging: An Art And A …
Health & Nutrition
ISBN:
9781337711067
Author:
Richard R. Carlton, Arlene M. Adler, Vesna Balac
Publisher:
Cengage Learning