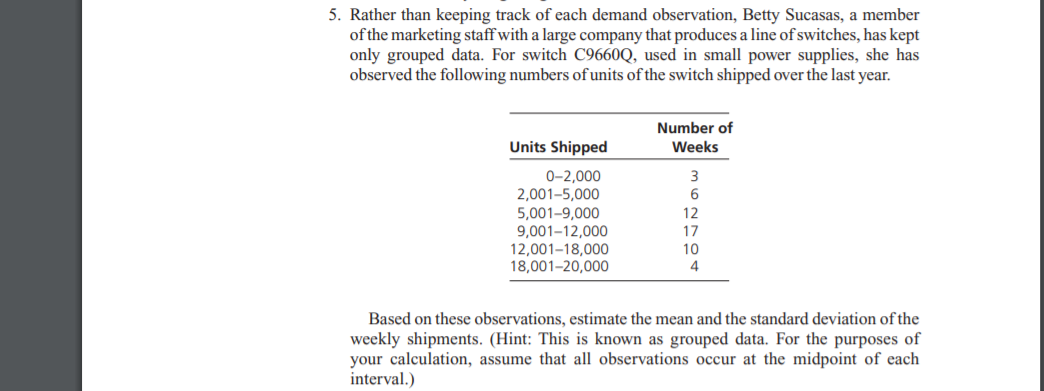
5. Rather than keeping track of each demand observation, Betty Sucasas, a member of the marketing staff with a large company that produces a line of switches, has kept only grouped data. For switch C9660Q, used in small power supplies, she has observed the following numbers of units of the switch shipped over the last year. Number of Units Shipped Weeks 0-2,000 2,001-5,000 5,001-9,000 9,001-12,000 12,001–18,000 18,001-20,000 12 17 10 4 Based on these observations, estimate the mean and the standard deviation of the weekly shipments. (Hint: This is known as grouped data. For the purposes of your calculation, assume that all observations occur at the midpoint of each interval.)
Q: Demand for portable music players for joggers has caused Nancy Industries (Nancy) to grow almost 50…
A: Let the linear regression equation is given by Y = A + Bt where t is time in months,…
Q: A manufacturer wants to optimize its shipment of goods to its customers. To minimize their turnover…
A: Here, we have the data of temperature recorded at the location of its retail shops and record of…
Q: 2. A farmer has recently acquired a l10 hectares piece of land. He has decided to grow Wheat and…
A: Let x represents the total area for wheat farming land and y represents the total area for barley…
Q: 5. Consider the demand for a cellphone model. Assume K=$450 and h-$3 week 2 4 demand 495 540 900 660…
A: Given :The demand for a cellphone model.K=$450 and h=$3.
Q: The researcher wishes to use graphical descriptive methods to present summaries of the data on each…
A: a. The 2k rule is often used to identify the number of class intervals, k, for a given raw data set…
Q: 7. Lawson's Department Store faces a buying decision for a seasonal product for which demand can be…
A: The prior probabilies for the states of nature are :P(51) = 0.3P(-2) = 0.3P(53) = 0.4
Q: Data collected from the economy of Cardtown reveals that a 16% increase in income leads to the…
A:
Q: Given the following demand for ten-period time frame as shown in the table below. Compute the…
A: For the given data Compute the three-period and five-period moving average forecasts. Plot the…
Q: a) Agnes, a General Manager in XXX Company, estimated a multiplicative demand function of the form:…
A: Estimated demand equation is given by, Qd= aPapIaiP0a0 Then Qd= 0.022*P(-223)I1.354P00.133
Q: Hankuk Electronics started production on a sophisticated new smartphone running the Android…
A: The regression line is defined as: Step by step procedure to obtain the regression line: Enter the…
Q: Determine the optimal product mix by means of the application of linear programming techniques.
A: Assume that k be the number of units produced of product King and q be the number of units produced…
Q: Answer the question on the basis of the following short run demand and cost data for a specific…
A: answer is in next step
Q: Estimate the equilibrium price and quantity of the market whose demand and supply functions are pd =…
A:
Q: 1. Referring to the pollution data of Table 1: Table 1: Measures of Solids and Chemical Oxygen…
A: Use the given data to form regression table in excel: SUMMARY OUTPUT…
Q: Given the Actual Demand from January to June of 2021, along with the forecasts based on three (3)…
A: Given Information: Consider the given dataset: Month Actual Method 1 Method 2 Method 3 JAN…
Q: Jerusalem Medical Ltd., an Israeli producer of portable kidney dialysis units and other medical…
A:
Q: A company produces two different grades of steel, A and B at two different factories, 1 and 2. The…
A: In this question, we model the problem in LPP form and then solve by using graphical method.
Q: A company that operated 10 hours a day manufactures two products on three sequential processes. The…
A: We need to choose correct option.
Q: - Part 1 Rework problem 24 in section 1 of Chapter 7 of your textbook, about the Columbus…
A: Solution :-
Q: A firm operates with the production function Q = K2L Q is the number of units of output per day…
A:
Q: 2- one of the factories producing carpentry chairs and tables so that each type of these products…
A: We can use a graphical method to solve this linear programming problem. Let us take the number of…
Q: 2. The demand for hand sanitizers is off the charts due to this corona virus outbreak. People are in…
A: X:- 12, 13, 14, 15, 17, 18, 21, 25 Y:- 1000, 1550, 1600, 1800, 1900, 2200, 2700, 3500…
Q: Find the production schedule for the technology matrix and demand vector given below:
A: Given that A=0.10.20.31.40.41.50.400.2andD=357 to find the production schedule for given technology…
Q: The production planning period for flat-screen moni-tors at Louisiana’s Roa Electronics, Inc., is 4…
A: The transportation problem (TP) is a remarkable kind of Linear Programming problem where the goal is…
Q: Demand for stereo headphones and MP3 players for joggers has caused Nina Industries to grow almost…
A: Given Month demand January 4000 February 4100 March 3800 April 4200 May 4850 June…
Q: Acme Manufacturing Company has a contract to deliver (100 + XX), (250 + XX), (190 + XX), (140 + XX),…
A:
Q: Consider the facility location problem as shown on the figure below, where a network model of an…
A: We will chose minimum distanced paths from node 1 to node 9.
Q: The Board of Governors of the Federal Reserve System publishes data on mortgage debt outstanding by…
A: Given data Year Debt 1 529 2 554 3 559 4 602 5 672 6 669 7 600 8 538 9 490…
Q: Gulong Inc are manufacturers of brakes sets for sedan and off-road SUVS vehicles. 500 hours is the…
A: We will construct a linear programming problem according to the given conditions and solve it using…
Q: What is the minimum annual total cost (ordering, holding and purchasing) if the buyer places…
A: Solution: Project X Order size Per per unit Purchase cost of 600 units Ordering cost Carrying cost…
Q: A line of LRT with five (5) stations will be constructed in a city. A forecast passenger demand is…
A: …
Q: Miami Central som:. 16. 15. (3500, 460), 1000 450 (3,860 900 400 800 350 (5) 700 * 300 (1000, 310)…
A: In this question we will use basic of algebra i.e equation of straight line when two points are…
Q: A manufacturing firm has four factories from which product is shipped to three warehouse for onward…
A:
Q: A company that operated 10 hours a day manufactures two products on three sequential processes. The…
A:
Q: 3. (c-f). The Gorman Manufacturing Company must decide whether to manufacture a component part at…
A: Conditional Probabilities: P(F,s1)=0.10, P(F,s2)=0.40 ,P(F,s3)=0.60 P(U,s1)=0.90, P(U,s2)=0.60…
Q: A producer of high end exercise equipment operates 6 hours per day, 350 days per year, and has a…
A:
Q: Refer to the comparison line graph which shows how the net worth of Claire Kozar's retirement…
A: Consider the graph provided in question. The graph represents the retirement savings at different…
Q: MJ Mining Company owns three mines and has three different types of ores that is mined. For each…
A: Given that MJ Mining company owns three mines and has three different types of ores that is mined.…
Q: A Juarez, Mexico, manufacturer of roofing supplies has developed monthly forecasts for a family of…
A:
Q: Suppose that the market for air travel between Chicago and Dallas is served by just two airlines,…
A: Let PA = PU = P (= $300) QdU = 10,000 - 100P + 99P = 10,000 - P QdA = 10,000 - 100P + 99P = 10,000 -…
Q: 3 A company must meet the following demands for a product: January, 30 units; February, 30 units;…
A: a) Production capacity of the company is the amount of supply. So, each month is considered…
Q: The input-output table for a two-sector economy is given as follows: Input to Sector Input to Sector…
A: Input-Output analysis is a type of economic model that describes the interdependent relationships…
Q: Company Y has the following inventory data: 20 units at $10 August 1 Beginning inventory 8 Purchases…
A:
Q: A manufacturer of microcomputers produces three different models. The following table summarizes…
A: As per bartleby expert policy, only first three subparts are to be answered. Kindly repost remaining…
Q: Provide a bar chart (with data labels rounded to two decimal points) showing the average demand for…
A: Consider the following table:- Weekday Date Sum of Daily Demand Average Mon…
Q: In a M/M/1 model, the average waiting time in the queue is 39 minutes, and the average service time…
A:
Q: 1.The five week demand forecasts are given in the following table: Week Demand 1 4 3 360 220 260 140…
A:
Q: Second, the researcher wishes to use graphical descriptive methods to present summaries of the data…
A: a) One of the conditions for selecting the number of classes is, 2number of classes ≥ sample…
Q: A shoe wholesaler wants to optimize its shipment of shoes to its client retailers. To minimize their…
A: Problem statement: wholesaler wants to know if weather conditions are important in determining the…
Trending now
This is a popular solution!
Step by step
Solved in 3 steps with 4 images
- Demand for stereo headphones and MP3 players for joggers has caused Nina Industries to grow almost 50 percent over the past year. The number of joggers continues to expand, so Nina expects demand for headsets to also expand, because, as yet, no safety laws have been passed to prevent joggers from wearing them. Demand for the players for this year was as follows: MONTH DEMAND (UNITS) January 4,200 February 4,300 March 4,000 April 4,400 May 5,000 June 4,700 July 5,300 August 4,900 September 5,400 October 5,700 November 6,300 December 6,000 Using linear regression analysis, what would you estimate demand to be for each month next year? Using a spreadsheet, follow the general format in Exhibit 3.7. Note: Do not round intermediate calculations. Round your answers to 2 decimal places. To be reasonably confident of meeting demand, Nina decides to use three standard errors of estimate for safety. How many additional units should be held to meet this level…The company has data on demand and factory capacity for the next 4 months as in the table. Unit cost with regular time $ 24, overtime cost $ 28, on subcontract $ 34. Storage costs $ 2 per unit per month; backorders cost $ 5 per unit per month. Initial inventory is as many as 120 units, and it is expected that by the end of July there will be an inventory of 100 units. April May June July Demand 460 450 480 480 Regular Capacity 370 370 380 380 Overtime Capacity 60 60 60 60 Subcontract Capacity 30 30 30 30 Use the transportation method to optimize the aggregate plan. Determine the production cost each month and the total cost for 4 monthsThe Arctic Air Company produces residential air conditioners. The manufacturing manager wants to develop a sales and operations plan for the next year based on the following demand and capacity data (in hundreds of product units): Undertime is unpaid, and no cost is associated with unused overtime or subcontractor capacity. Producing one air conditioning unit on regular time costs $1,000, including $300 for labor. Producing a unit on overtime costs $1,150. A subcontractor can produce a unit to Arctic Air specifications for $1,250. Holding an air conditioner in stock costs $60 for each 2-month period, and 200 air conditioners are currently in stock. The plan calls for 400 units to be in stock at the end of period 6. No backorders are allowed. Use the transportation method to develop a plan that minimizes costs.
- The customer demand for a particular smart phone during Year 0 to Year 5 is given as 1,056,000, 1,032,000, 1,093,000, 1,024,000, 1,066,000, and 1,072,000. Using the Holt forecasting model with trend, what is the forecasted demand in year 10, where w = 0.4 and v = 0.5?a) 1,071,874b) 1,075,573c) 1,077,488d) 1,083,816The problem is based on the following data given. Observations of the demand for a certain part stocked at a parts supply depot during the calendar year 2013 were ( as shown ). Using a four-month moving average, determine the two-step-ahead forecast for July through December 2013. (Hint: The two-step-ahead forecast for July is based on the observed demands in February through May.)Marcia Baker is the new manager of the materials storeroom for Keller Manufacturing. Marcia has been asked to estimate future monthly purchase costs for part #696, used in two of Keller's products. Marciahas purchase cost and quantity data for the past 9 months as follows: Month Cost of Purchase Quantity Purchased January $12,410. 2,730 parts February. 12,880 2,880 March 17,505 4,148 April 15,869 3,761 May 13,170 2,912 June 13,867 3,332 July 15,237 3,644 August 10,061 2,287 September 14,960 3,582 Estimated monthly purchases for this part based on expected demand of the two products for the rest of the year are as follows: Month Purchase Quantity Expected October…
- You run a Pharmacy and have to decide how many packets of face masks to order for resale during this Corona virus pandemic period. You can only order in batches of 100. If only 100 batches are ordered, it will cost K10 per unit, if 200 or more, K9 per unit; and if 300 or more, it will cost K8.50 per unit. The results of a market survey you conducted show that the potential levels of demand are 100, 150, or 200; at 50%, 20%, and 10% probability, respectively. The selling price is K15 per unit and any stock unsold by the end of peak period for the pandemic will be sold for half the price. There is a cost of K0.55 per unit for any stock-outs experienced. Required: Using Microsoft Excel: Calculate the EMV of each alternative order level and the recommended order level. What is the net earnings at the recommended order level? Determine the order level at which net earnings are zero (breakeven order level).Given the following demand for ten-period time frame as shown in the table below. Compute the three-period and five-period moving average forecasts. Plot the actual demand and the forecasts on the same graph. Period 1 2 3 4 5 6 7 8 9 10 Demand (in units) 24 25 28 32 35 38 41 46 49 53 Forecast Table: Period Actual 3-Moving Averages 5-Moving Averages 1 24 2 25 3 28 4 32 5 35 6 38 7 41 8 46 9 49 10 53 11A large St. Louis feed mill, Robert Orwig Processing, prepares its 6-month aggregate plan by forecasting demand for 50-pound bags of cattle feed as follows: January, 1,000 bags; February, 1,200; March, 1,250; April, 1,450; May, 1,400; and June, 1,400. The feed mill plans to begin the new year with no inventory left over from the previous year and backorders are not permitted. It projects that capacity (during regular hours) for producing bags of feed will remain constant at 800 until the end of April, and then increase to 1,100 bags per month when a planned expansion is completed on May 1. Overtime capacity is set at 300 bags per month until the expansion, at which time it will increase to 400 bags per month.
- Dave Fletcher, the general manager of North Carolina Engineering Corporation (NCEC), thinks that his firm’s engineer-ing services contracted to highway construction firms are directly related to the volume of highway construction business contractedwith companies in his geographic area. He wonders if this is reallyso, and if it is, can this information help him plan his operationsbetter by forecasting the quantity of his engineering servicesrequired by construction firms in each quarter of the year? Thefollowing table presents the sales of his services and total amountsof contracts for highway construction over the past eight quarters: a) Using this data, develop a regression equation for predictingthe level of demand of NCEC’s services. b) Determine the coefficient of correlation and the standard errorof the estimate.Molly O'Malley is the new manager of the materials storeroom for Tudor Manufacturing. Mollly has been asked to estimate future monthly purchase costs for part #696, used in two of Tudor's products. Molly has purchase cost and quantity data for the past 9 months as follows: Month Cost of Purchase Quantity Purchased January $12,410 2,650 parts February 12,770 2,850 March 17,403 4,116 April 15,838 3,761 May 13,249 2,901 June 14,022 3,376 July 15,237 3,644 August 10,087 2,287 September 14,900 3,592 Estimated monthly purchases for this part based on expected demand of the two products for the rest of the year are as follows: Month Purchase Quantity Expected October 3,350 parts November 3,770 December 3,050 The computer in Molly's office is down, and Molly has been asked to immediately provide an equation to estimate the future purchase cost for part #696. Molly grabs a calculator and uses the high-low method to estimate a cost equation. What…A manufacturing firm has four factories from which product is shipped to three warehouse for onward distribution to stores. The following table reports a partial shipment plan to meet demand. The partial shipment plan, the total supplies at the factories and the required demands at the warehouses are reported in the table below. Factory Warehouse A Warehouse B Warehouse C Supply Factory 1 70 210 100 380 Factory 2 110 90 Answer 278 Factory 3 200 110 220 530 Factory 4 120 90 80 290 Demand 500 500 478 For the above shipment plan to be feasible, what is the number of units shipped from Factory 2 to Warehouse C? Report the number within the table.