Data collected from the economy of Cardtown reveals that a 16% increase in income leads to the following changes: • A 6% Increase in the quantity of chips demanded • A 14% decrease in the quantity of spades demanded • A 29% increase in the quantity of houses demanded Compute the income-elasticity of demand for each good and use the dropdown menus to complete the first column in the following table. Then, based on its income elasticity, indicate whether each good is a normal good or an inferior good. (Hint: Be careful to keep track of the direction of change. The sign of the income elasticity of demand can be positive or negative, and the sign confers important information.) Good Income Elasticity of Demand Normal or Inferior Good Chips Spades Houses Which of the following three goods is most likely to be classified as a luxury good ? O Spades O Chips O Houses
Data collected from the economy of Cardtown reveals that a 16% increase in income leads to the following changes: • A 6% Increase in the quantity of chips demanded • A 14% decrease in the quantity of spades demanded • A 29% increase in the quantity of houses demanded Compute the income-elasticity of demand for each good and use the dropdown menus to complete the first column in the following table. Then, based on its income elasticity, indicate whether each good is a normal good or an inferior good. (Hint: Be careful to keep track of the direction of change. The sign of the income elasticity of demand can be positive or negative, and the sign confers important information.) Good Income Elasticity of Demand Normal or Inferior Good Chips Spades Houses Which of the following three goods is most likely to be classified as a luxury good ? O Spades O Chips O Houses

Linear Algebra: A Modern Introduction
4th Edition
ISBN:9781285463247
Author:David Poole
Publisher:David Poole
Chapter2: Systems Of Linear Equations
Section2.4: Applications
Problem 23EQ:
23. Consider a simple economy with just two industries: farming and manufacturing. Farming consumes...

Related questions
Question
4
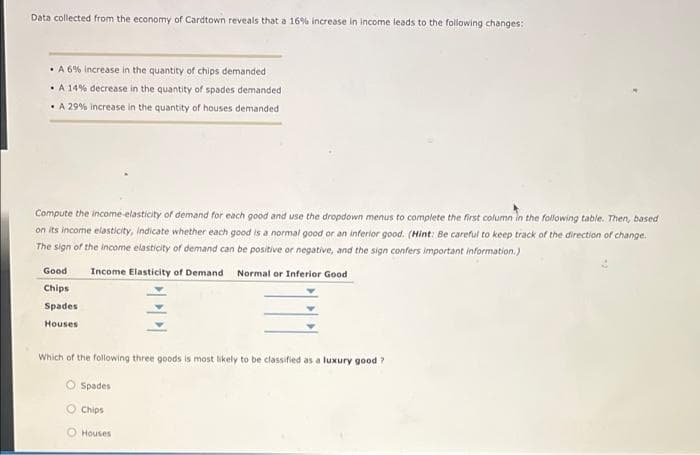
Transcribed Image Text:Data collected from the economy of Cardtown reveals that a 16% increase in income leads to the following changes:
• A 6% Increase in the quantity of chips demanded
• A 14% decrease in the quantity of spades demanded
• A 29% Increase in the quantity of houses demanded
Compute the income-elasticity of demand for each good and use the dropdown menus to complete the first column in the following table. Then, based
on its income elasticity, indicate whether each good is a normal good or an inferior good. (Hint: Be careful to keep track of the direction of change.
The sign of the income elasticity of demand can be positive or negative, and the sign confers important information.)
Good
Income Elasticity of Demand Normal or Inferior Good
Chips
Spades
Houses
Which of the following three goods is most likely to be classified as a luxury good ?
Spades
O Chips
O Houses
Expert Solution
This question has been solved!
Explore an expertly crafted, step-by-step solution for a thorough understanding of key concepts.

This is a popular solution!

Trending now
This is a popular solution!

Step by step
Solved in 2 steps with 2 images

Recommended textbooks for you
Linear Algebra: A Modern Introduction
Algebra
ISBN:
9781285463247
Author:
David Poole
Publisher:
Cengage Learning
Linear Algebra: A Modern Introduction
Algebra
ISBN:
9781285463247
Author:
David Poole
Publisher:
Cengage Learning