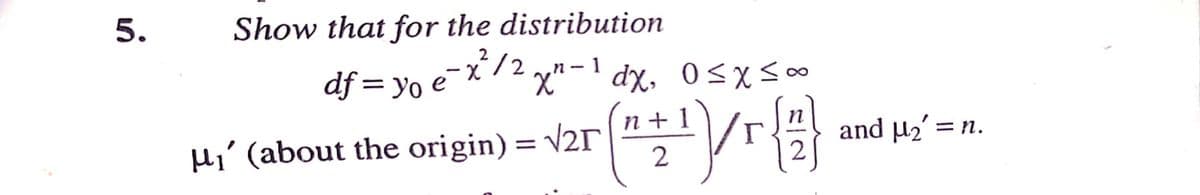
5. Show that for the distribution df = yo e¯x/2 " – 1 dx, 0sxs∞ n-1 n + Hj' (about the origin) = v2r and µ2' = n. %3D


Q: Assume that thermometer readings are normally distributed with a mean of 0°C and a standard…
A: According to policy we can answered only first question, for remaining please repost the question.
Q: Ervin determined the amount of CaCO3 (as ppm) in their municipality water. Based on his results are…
A: The given data set is, 155, 165, 138, 172, 127, 193, 142 The value of sample mean is,
Q: (CLO-1) An election involving 6 candidates and 40 voters is held, and the results of the election…
A: Given that An election involving 6 candidates and 40 voters is held, and the results of the…
Q: The mean height of an adult giraffe is 17 feet. Suppose that the distribution is normally…
A: GivenMean(μ)=17standard deviation(σ)=0.8
Q: Many states are carefully considering steps that would help them collect sales taxes on items…
A:
Q: The scores of the top ten finishers in a recent Buick Open are listed below. Find the median score.…
A: We have given that, The data set are : 65, 66, 67, 66, 67, 70, 67, 70, 71, 68 Then, We will find…
Q: For a cooking oil company, the price they are paid for coconuts in large shipments is based on the…
A:
Q: Using the method that we learned in this course and ANY tools/methods (e.g., R, Excel, calculator,…
A: Given: 3072, 1989, 3794, 2689, 3211, 3722, 4385, 4009, 7598, 3862, 3097, 2726, 4881, 4157, 2570,…
Q: Suppose that each of n jurors independently has a 0.7 probability of deciding correctly whether an…
A: GivenThe number of jurors =nthe probability that each juror decide correctly if an accused person is…
Q: 1. Distribution of annual rainfall depth for a scale is matched as normal distribution. From sample,…
A: Given : Population Mean,μ = 80 Population Standard Deviation,σ = 10
Q: Use the mixed congruential method to generate a sequence of 32 random numbers with Xo=8, a=9, c=13,…
A:
Q: Compute the following averages: b. During the past week, the following number of cases of measles…
A:
Q: a. Most of the live characters at an amusement park have height requirements with a minimum of 4 ft…
A: A survey found that women's heights are normally distributed with mean 63.1 in. and standard…
Q: 1. A random sample of 40 packs of certain brand of marshmallow have a mean weight of 7.5 grams with…
A: From the provided information, Sample size (n) = 40 Sample mean (x̄) = 7.5 Standard deviation (s) =…
Q: Consider the probability density f(x) = ae-bl, where x is a random variable whose allowable values…
A:
Q: In a survey of 10,000 IV drug abusers in town A, 1,000 turn out to be infected with hepatitis C and…
A:
Q: 1. (a) lind autocovariance function and autocorrelation function of Poisson Process. (b) If X) A cos…
A: Note: Hi, there! Since multiple questions are posted. We are allowed to solve single question at a…
Q: Play the piano: Georgianna claims that in a small city renowned for its music school, the average…
A: Solution-: Given: x¯=4.6, μ0=5, n=20, s=2.2 (a) Identify null and alternative hypothesis…
Q: You wish to test the following claim (H1) at a significance level of α=0.001. H0:μ=72.2…
A: GivenThe null and alternative hypothesis is H0:μ=72.2H1:μ≠72.2sample size(n)=7Mean(x)=58.1standard…
Q: regression was run to determine if there is a relationship between hours of TV watched per day (x)…
A: Given that ; X represents the hours of TV watched per day ( Y represents number of situps a person…
Q: The number of pounds of steam used per month by a chemical plant is thought to be related to the…
A: The independent variable is Temperature. The dependent variable is Usage/1000. We have to do…
Q: 4. Students arrive at a tutoring center to a Poisson process with a rate of 10 per hour. a) What is…
A:
Q: A study of 420,035 cell phone users found that 0.0326% of them developed cancer of the brain or…
A: From the provided information, Sample size (n) = 420035 Sample proportion (p̂) = 0.000326 Confidence…
Q: Use the sample data with a 0.01 significance level to test the claim that for the population of ages…
A: Let ud is the mean value of the differences d for the population of all pairs of data, where each…
Q: population of beetles are growing according to a linear growth model. The initial population (week…
A: Given P0=6 P6=36
Q: Construct the cumulative frequency distribution for the given data. Age (years) of Best Actress when…
A: cumulative frequency : It is calculated by adding each frequency from a frequency distribution table…
Q: You are conducting a multinomial Goodness of Fit hypothesis test for the claim that the 4 categories…
A:
Q: 6. Eddie finds that there is a significant negative correlation between variables X and Y. Given…
A: Correlation is the measure of association between the variables. A negative correlation means that…
Q: 36. Let p be the probability that a man aged x years dies in a year. Find the probability that out…
A:
Q: 5. Let X have a uniform distribution on the interval (0,2). Given X = x, let Y have a (conditional)…
A:
Q: Your school is trying to refine its textbook budget. The following table shows the average cost of…
A: Solution-: Let, X=be the average cost of a textbook and Y=be the curriculum year Given data: X Y…
Q: A researcher wishes to see of the way people to obtain information is independent of their…
A: tep 1: Null Hypothesis: H0: The way people is independent of their educational background.…
Q: Here is a bivariate data set in which you believe y to be the response variable. y 61.3 38 56.3 38.3…
A: Scatter plot: Excel Procedure: Enter x and y in Excel>Data>Data Analysis>…
Q: Data on the numbers of hospital admissions resulting from motor vehicle crashes are given below for…
A:
Q: The cdf of a random variable Y is |1– exp(-0.4y), y 20 F,(y) otherwise Valuate P{2.5 <Y < 6.2}.
A:
Q: The lifetime of a 2-volt non-rechargeable battery in constant use has a Normal distribution, with a…
A:
Q: You are at a party with 50 people, including yourself. Everyone at the party is between 18 and 25…
A:
Q: If a student from that college is selected at random and it is learned that he/she wants to change…
A: here define events drive to class = D public Transportation = T walk = W wants to change the…
Q: Ten percent of the fiber produced by the current method fails to meet the minimum specification.…
A:
Q: Given the following data, which is the equation of the regression line? X 0 3 4 5 8 Y 12 6 3 3 1…
A: Introduction: The regression line: The regression line of Y on X can be given as, Y=a+bX Where, Y…
Q: The salaries of professional baseball players are heavily skewed right with a mean of $3.2 million…
A: The sample standard deviations are s1=2 and s2=1.5.
Q: QUESTION 28 Which of the following statements stated below is precisely correct? OA Coefficient of…
A: Introduction Coefficient Of Variation: Definition: The coefficient of variation is the relative…
Q: 1.For each of the following sample methods state the definition, outline the steps involved in their…
A: (A) Simple random sampling Definition: In Simple random sampling (SRS), a sample is selected from a…
Q: Assume that a sample is used to estimate a population mean μ . Find the margin of error M.E. that…
A: We have given that, Sample mean = 76.5, sample size (n) = 7, standard deviation (s)= 8.9 and…
Q: Part: 1/ 3 Part 2 of 3 If the price of eggs differs by $0.25 from one month to the next, by how much…
A:
Q: a. Identify the critical value t/2 used for finding the margin of error. (Round to two decimal…
A: Given : Sample Size, n = 36 Sample Mean, x̄ = 3180.6 standard deviation, s…
Q: Q2 A new all-purpose cleaner is being test-markete locations in various supermarkets. The numbers…
A: By applying the ANOVA test for a single factor,
Q: 2. A random sample of 25 jars of instant coffee has a mean weight of 195.75 grams with a standard…
A: The random variable weight follows normal distribution. We have to test whether the mean weight is…
Q: Questions: #1: What does this scatter plot look like? # 2: Describe what the graph is doing.
A: For the given data, we need to draw a scattered plot and describe it.
Q: Which class had the higher minimum? 68 69 70 71 72 73 74 75 76 77 78 79 80 81 82 83 84 85 86 87 88…
A: Given that ; A box plot is given for two classes firstly find out the five number summary of both…

Step by step
Solved in 2 steps with 2 images

- Find the average rates of change of f(x)=x2+2x (a) from x1=3 to x2=2 and (b) from x1=2 to x2=0.Use the table of values you made in part 4 of the example to find the limiting value of the average rate of change in velocity.Consider the joint PDF f(x,y)=4xy for 0<x<1 and 0<y<1. (a) Are X and Y independent?(b) Find both marginal distributions. (c) Find both conditional distributions.
- suppose x has an exponential distribution with probability density function f(x) =2e^-2x, x>0. Then P(X>1)If X is an exponential random variables with rate 1, then its distribution function is given by F(x) = 1 − e−x Show that x = − ln(1 − u).In a t-distribution, what is the area under the curve that is to the right of t=2.048 and with df=28? (Show solution)
- In a t-distribution, what is the area under the curve that is to the right of t=2.048 and with df=28?For c in R, calculate E[e^cX] where X is exponential distribution.Find the mean and variance of the gamma distributionusing integration to obtain E(X) and E(X2).[Hint: Express the integrand in terms of a gammadensity.]
- Suppose that n observations are chosen at random from a continuous pdf fY(y). What is the probability that the last observation recorded will be the smallest number in the sample?2 Given the exponential distribution: f(x) = {1/θ e^(-x/θ) ; x > 0 0; ew]Suppose that n observations are chosen at random from a continuous pdf fY(y). What is the probability that the last observation recorded will be the smallest number in the sample? I asked this question earlier today, but didn't quite understand all of the response. P(y1<=yn)p(y2<=yn) and so on was used, but shouldn't the yn be listed first in the inequality since we want to know if yn is the smallest?
