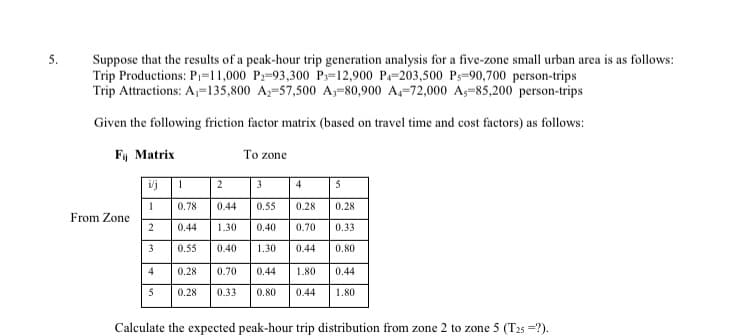
5. Suppose that the results of a peak-hour trip generation analysis for a five-zone small urban area is as follows: Trip Productions: Pi=11,000 P-93,300 Ps=12,900 P-203,500 Ps-90,700 person-trips Trip Attractions: A,=135,800 A;-57,500 A,-80,900 A,-72,000 As-85,200 person-trips Given the following friction factor matrix (based on travel time and cost factors) as follows: Fy Matrix To zone ilj 3 4 5 1 0.78 0.44 0.55 0.28 0.28 From Zone 2 0.44 1.30 0.40 0.70 0.33 3 0.55 0.40 1.30 0.44 0.80 0.28 0.70 0.44 1.80 0.44 0.28 0.33 0.80 0.44 1.80
Q: The following problem refers to a closed Leontief model Suppose the technology matrix for a closed…
A: The technological equation for a closed Leontief model is given as follows.
Q: Q1. The daily spending of 5 customers in PKR on Product X and Product Y is as under: Customer X Y…
A: We can analyze the numerical data by using graphical techniques. We can visually display,…
Q: $100,000 into stock market investments and also into purchasing precious metals. The performance of…
A: We can use formula of stock and commodity for solving the given question
Q: 4- The goal of the row-reduction phase in the Gauss elimination method is to convert the coefficient…
A:
Q: A major long-distance telephone company (company A) has studied the tendency of telephone users to…
A: Given that the probability of a customer who uses A's service will switch to a competing service is…
Q: In the Heidman’s Department Store problem of Unit 2 of this module, suppose that the following…
A: image is attached
Q: A simplified version of input-output analysis of a national economy has the following input-output…
A:
Q: Consider the following dissimilarity matrix for use in hierarchical clustering using average…
A: Here, we know Hierarchical clustering is an algorithm which groups similar things into groups called…
Q: A herd of American buffalo (bison) can be modeled by a stage matrix similar to that for the spotted…
A:
Q: 8. Draw the graph of the given adjacency matrix: 0 3 0 2 3 0 1 0 1 1 1 2 2 1 2 0
A: Given Adjacency matrix is, A = a11a12a13a14a21a22a23a24a31a32a33a34a41a42a43a44=0302301101122120 By…
Q: A simplified version of input-output analysis of a national economy has the following input-output…
A: Let A be the given matrix A=0.2450.1020.0510.0990.2910.2790.4330.3720.011 Let X=AMH where H= 1 unit…
Q: A primitive economy consists of a fishing industry and an oil industry. A unit of fahing industry…
A: please re-correct Solution of part (A) as follows :
Q: Assume that the averages of all factors other than educ have remained constant over time and that…
A: From the data the regression model is obtained as, Kids = –7.742 – 0.128 educ + 0.532 age –0.0058…
Q: According to data collected during one year in a large metropolitan community, 30% of commuters used…
A:
Q: 1.5 2 Suppose that G = is the Leslie Matrix of a population with two age groups. a (a) For which…
A: note : As per our company guidelines we are supposed to answer ?️only the first question. Kindly…
Q: Draw a graph that has the given adjacency matrix
A:
Q: A simplified version of input-output analysis of a national economy has the following input-output…
A:
Q: (b) At the beginning of 1990, the population of California was 29, 716, 000, and the population…
A: Determine the rates for the people staying and leaving for each city and substitute it in the…
Q: 1. a. Define briefly the following terminologies in relation to a 22 factorial design i. Standard…
A: Standard order:- the order of writing the treatment is called the standard order. Total effect of A…
Q: Draw a graph that has the given adjacency matrix
A: Graph is a method of representation of the connectivity of the nodes. In this we have to choose a…
Q: 2. Draw a graph from the given adjacency matrix. 1 0 0 1 0 1 0 1 0 1 1
A: Given an adjacency matrix A=11000101010001101110 We want to draw the graph from this adjacency…
Q: Assumption 1: Linear Parameter and correct model specification Assumption 2: Full Rank of Matrix X…
A: If one of them assumptions is violated then the results of the hypothesis tests and confidence…
Q: The following are the demand and supply functions for three competing mobile phone models of…
A: To bring the supply and demand levels into equilibrium equate all the demand and supply of the given…
Q: From: State A Rest of U.S. To: 0.9727 0.0059 State A 0.0273 0.9941 Rest of U.S Determine the…
A:
Q: A population is modeled with three larva, pupa and adult, and the resulting structured 0 0.6…
A: Given the transition matrix of a population model as 0 0 0.60.5 0 000.9 0.8
Q: (Recall that 1 g. = 1 gram = 1000 milligrams, and 1 kg. = 1 kilogram = 1000 grams.) Suppose the…
A: As per the question we are given the production matrix P and the required number of units. And we…
Q: A simplified version of Leontief's analysis of the 1947 American economy has the following…
A:
Q: From data collected by the Association of Realtors of a certain city, the following tran- sition…
A:
Q: Find the production matrix for the following input-output and demand matrices using the open model.…
A: Determine the production matrix by its formula. Determine the matrices needed in the formula.…
Q: The following problem refers to a closed Leontief model. Suppose the technology matrix for a closed…
A:
Q: 2. In a two-industry economy. it is know that industry I uses 10 cents of its own product and 60…
A: a) Let x represents the output level of industry I and y represents the output level of industry II.…
Q: Draw an undirected graph represented by the given adjacency matrix. 1 3 0 4 1 2 1 3 3 1 1 1 3 0 0 [4…
A: Given: A=0130412130311010300240123 The matrix A represent the adjacency matrix. We have to Draw the…
Q: A simplified version of input-output analysis of a national economy has the following input-output…
A: (a) From The given Input - Output table : 0.433 units of households are need to produce one unit of…
Q: 3. Draw the graph for the following adjacency matrix. 0 1 3 0 4 1 2 1 3 3 1 1 0 1
A: Since you have posted multiple questions but according to guidelines we will solve first question…
Q: Suppose a primitive economy consists of three industries: the agricultural industry, the…
A:
Q: Suppose the population of a particular endangered bird changes on a yearly basis as a discrete…
A: As per the question we are given a chicken population model in terms of discrete dynamic system. And…
Q: PG2 ОPEN Turned in automatically when late peric To produce a unit of electricity, 0.12 units of…
A: Given A=0.120.070.230.24 and D=20004300 We have to find the X=x1x2. We have to solve AX=D ⇒X=A−1D…
Q: Ruphone Ltd has a choice of 3 mutually exclusive projects. The profits of the respective projects…
A:
Q: 1 4 6 8) 10 a. Construct the adjacency matrix. Why is it a block-diagonal matrix? b. Construct the…
A:
Q: As part of their investment strategy, the Carringtons have decided to put $100,000 into stock market…
A:
Q: Suppose that the economy of a small nation has an electronics industry, a steel industry, and an…
A: Given: A=0.60.20.20.10.40.50.10.20.2, and surplusesD=92252237
Q: As part of their investment strategy, the Carringtons have decided to put $100,000 into stock market…
A:
Q: Suppose that the economy of a small nation has an electronics industry, a steel industry, and an…
A: Consider the matrix, A=ESA0.60.20.20.10.40.50.10.20.2 Let x be the gross production of electronics…
Q: Draw an undirected graph represented by the following adjacency matrix 0 2 3 1 2 2 3 3 0 1 1 0 3 3 3
A:
Q: A retailer classifies accounts as having one of four possible states: "paid up." "overdue at most 30…
A: Retailer classifies account : Paid up, over due at least 30 days, over due less than 60 but more…
Q: Suppose you are using a Leslie population growth model to study a species split into two age groups…
A:
Q: Julia is a freelance hakers. She receives a few cake orders, for this Saturday. Since she got quite…
A: The distance locations are given as follows: 1 2 3 4 5 6 7 8 9 10 1 ** 5.1 12.5 13 7.5 13.5 @…
Trending now
This is a popular solution!
Step by step
Solved in 7 steps with 12 images
- 1.Suppose that the weight of a type of organism is governed by a power law relationship with its length from snout to tail and the thickness of its central vertebraech 11. 4 Oxnard Petro, Ltd., has three interdisciplinary project development teams that function on an ongoing basis. Team members rotate from time to time. Every 4 months (three times a year) each department head rates the performance of each project team (using a 0 to 100 scale, where 100 is the best rating). Are the main effects significant? Is there an interaction?1. Referring to Scenario 13-11, which of the following is the correct interpretation for the slope coefficient?a) For each decrease of 1 thousand downloads, the expected revenue is estimated to increase by $ 3.7297 thousands.b) For each increase of 1 thousand downloads, the expected revenue is estimated to increase by $ 3.7297 thousands.c) For each decrease of 1 thousand dollars in expected revenue, the expected number of downloads is estimated to increase by 3.7297 thousands.d) For each increase of 1 thousand dollars in expected revenue, the expected number of downloads is estimated to increase by 3.7297 thousands.
- A quality control engineer studied the relationship between years of experience as a system control engineer and the capacity of the engineer to complete within a given time a complex control design including the debugging of all computer programs and control devices. A group of 25 engineers having widely differing amounts of experience (measured in months of experience) was given the same control design project. The results of the study are given in the following table with y = 1 if the project was successfully completed in the allocated time and y = 0 if the project was not successfully completed. a. Determine whether experience is associated with the probability of completingthe task. b. Compute the probability of successfully completing the task for an engineer having 24 months of experience. Place a 95% confidence interval on your estimate.Table 10-2 A problem with a phone line that prevents a customer from receiving or making calls is upsetting to both the customer and the telecommunications company. The file “Phone” contains samples of 20 problems reported to two different offices of a telecommunications company and the time toclear these problems (in minutes) from the customers’ lines: Central Office I Time to Clear Problems (minutes) 1.48 1.75 0.78 2.85 0.52 1.60 4.15 3.97 1.48 3.10 1.02 0.53 0.93 1.60 0.80 1.05 6.32 3.93 5.45 0.97 Central Office II Time to Clear Problems (minutes) 7.55 3.75 0.10 1.10 0.60 0.52 3.30 2.10 0.58 4.02 3.75 0.65 1.92 0.60 1.53 4.23 0.08 1.48 1.65 0.72 Assuming that the population variances from both offices are not equal, is there evidence of a difference in the mean waiting time between two offices? (Use a = 0.01) ▪ You may need to download file “Phone”. Referring to Table 10-2, judging from the way the data were collected, which test would likely be most appropriate to…Table 10-2 A problem with a phone line that prevents a customer from receiving or making calls is upsetting to both the customer and the telecommunications company. The file “Phone” contains samples of 20 problems reported to two different offices of a telecommunications company and the time toclear these problems (in minutes) from the customers’ lines: Central Office I Time to Clear Problems (minutes) 1.48 1.75 0.78 2.85 0.52 1.60 4.15 3.97 1.48 3.10 1.02 0.53 0.93 1.60 0.80 1.05 6.32 3.93 5.45 0.97 Central Office II Time to Clear Problems (minutes) 7.55 3.75 0.10 1.10 0.60 0.52 3.30 2.10 0.58 4.02 3.75 0.65 1.92 0.60 1.53 4.23 0.08 1.48 1.65 0.72 Assuming that the population variances from both offices are not equal, is there evidence of a difference in the mean waiting time between two offices? (Use a = 0.01) ▪ You may need to download file “Phone”. Referring to Table 10-2, at the α = 0.05 level, the correct critical value(s) is (are) Question 3 options:…
- Table 10-2 A problem with a phone line that prevents a customer from receiving or making calls is upsetting to both the customer and the telecommunications company. The file “Phone” contains samples of 20 problems reported to two different offices of a telecommunications company and the time toclear these problems (in minutes) from the customers’ lines: Central Office I Time to Clear Problems (minutes) 1.48 1.75 0.78 2.85 0.52 1.60 4.15 3.97 1.48 3.10 1.02 0.53 0.93 1.60 0.80 1.05 6.32 3.93 5.45 0.97 Central Office II Time to Clear Problems (minutes) 7.55 3.75 0.10 1.10 0.60 0.52 3.30 2.10 0.58 4.02 3.75 0.65 1.92 0.60 1.53 4.23 0.08 1.48 1.65 0.72 Assuming that the population variances from both offices are not equal, is there evidence of a difference in the mean waiting time between two offices? (Use a = 0.01) ▪ You may need to download file “Phone”. Referring to Table 10-2, at the α = 0.05 level, the decision is Question 5 options: 1) Cannot…Table 10-2 A problem with a phone line that prevents a customer from receiving or making calls is upsetting to both the customer and the telecommunications company. The file “Phone” contains samples of 20 problems reported to two different offices of a telecommunications company and the time toclear these problems (in minutes) from the customers’ lines: Central Office I Time to Clear Problems (minutes) 1.48 1.75 0.78 2.85 0.52 1.60 4.15 3.97 1.48 3.10 1.02 0.53 0.93 1.60 0.80 1.05 6.32 3.93 5.45 0.97 Central Office II Time to Clear Problems (minutes) 7.55 3.75 0.10 1.10 0.60 0.52 3.30 2.10 0.58 4.02 3.75 0.65 1.92 0.60 1.53 4.23 0.08 1.48 1.65 0.72 Assuming that the population variances from both offices are not equal, is there evidence of a difference in the mean waiting time between two offices? (Use a = 0.01) ▪ You may need to download file “Phone”. Referring to Table 10-2, the correct test statistic is Question 4 options: 1) 2.04, -2.04.…Suppose that the Lorenz Curve for country A is given by yA = x 2.2 and for country B is yB = 0.3x 2 + 0.7x. Use the Gini index to determine which of the two countries has greater inequality in its income distribution.
- The table below shows the number of state-registered automatic weapons and the murder rate for several Northwestern states. xx 11.9 8.1 6.9 3.8 2.3 2.7 2.4 0.7 yy 13.9 11.2 9.7 7.2 5.8 6.4 5.9 4.9 xx = thousands of automatic weaponsyy = murders per 100,000 residentsThis data can be modeled by the equation y=0.83x+4.08.y=0.83x+4.08. Use this equation to answer the following;Special Note: I suggest you verify this equation by performing linear regression on your calculator.A) How many murders per 100,000 residents can be expected in a state with 9 thousand automatic weapons?Answer = Round to 3 decimal places.B) How many murders per 100,000 residents can be expected in a state with 4 thousand automatic weapons?Answer = Round to 3 decimal places.The table below shows the number of state-registered automatic weapons and the murder rate for several Northwestern states. xx 11.8 8.6 7.1 3.9 2.5 2.6 2.4 0.4 yy 14.3 11.5 9.8 7.6 6.2 6.5 6.4 4.1 xx = thousands of automatic weaponsyy = murders per 100,000 residentsThis data can be modeled by the equation y=0.86x+4.07.y=0.86x+4.07. Use this equation to answer the following; Special Note: I suggest you verify this equation by performing linear regression on your calculator.A) How many murders per 100,000 residents can be expected in a state with 3 thousand automatic weapons?Answer = Round to 3 decimal places.B) How many murders per 100,000 residents can be expected in a state with 4.1 thousand automatic weapons?Answer = Round to 3 decimal places.The table below shows the number of state-registered automatic weapons and the murder rate for several Northwestern states. xx 11.3 8.6 7.1 3.3 2.4 2.3 2.4 0.7 yy 13.7 11.1 10.4 6.9 6.4 6.2 6.1 4.9 xx = thousands of automatic weaponsyy = murders per 100,000 residentsThis data can be modeled by the equation y=0.83x+4.28.y=0.83x+4.28. Use this equation to answer the following;Special Note: I suggest you verify this equation by performing linear regression on your calculator.A) How many murders per 100,000 residents can be expected in a state with 10.7 thousand automatic weapons?Answer = Round to 3 decimal places.B) How many murders per 100,000 residents can be expected in a state with 1.6 thousand automatic weapons?Answer = Round to 3 decimal places.The table below shows the number of state-registered automatic weapons and the murder rate for several Northwestern states. xx 11.3 8.6 7.1 3.3 2.4 2.3 2.4 0.7 yy 13.7 11.1 10.4 6.9 6.4 6.2 6.1 4.9 xx = thousands of…