TABLE 13.1 Determinants of Women's Fertility Dependent Varlable: kids Independent Variables Coefficients Standard Errors educ -.128 .018 age .532 .138 age? -.0058 .0016 black 1.076 .174 east .217 .133 northcen .363 .121 west .198 .167 farm -.053 .147 othrural -.163 .175 town .084 .124 smcity .212 .160 y74 .268 .173 y76 -.097 .179 y78 -.069 .182 y80 -.071 .183 y82 -.522 .172 y84 -.545 .175 constant -7.742 3.052 n = 1,129 R? = .1295 R = .1162
Q: Consider the following regression model: Weekly Hours = Bo + B1 × Wage¡ + u¿ Weekly Hours is the…
A: Given information: The regression model is given.
Q: il T-Mobile 11:42 am 48% Home Edit Yesterday 5:52 pm Canvas 因 国 Part of an Excel regression output…
A:
Q: For the following problem, select all answers that are correct. Under certain conditions, minimizing…
A: @solution:::
Q: Suppose a study wants to predict the market price of a certain species of turtle (Y) based on the…
A:
Q: Suppose a least-squares regression line is given by y= 4.302x -3.293. What is the mean value of the…
A: Regression analysis: The regression analysis is a statistical procedure that allow us to find the…
Q: Using the following information: Coefficients Intercept -12.8094 Independent variable 2.1794…
A: From the give information, y^=-12.8094+2.1794x
Q: The table below shows the number of state-registered automatic weapons and the murder rate for…
A: Solution : x = thousands of automatic weaponsy = murders per 100,000 residents data can be modeled…
Q: (b) For the following data- Class 40-50 60-70 70-80 50-60 6. 10-20 20-30 30-40 8 4 Frequency comment…
A:
Q: The number of adults (in millions) using e-book devices is expected to climb in the years ahead. The…
A:
Q: The following estimated regression equation relating sales to inventory investment and advertising…
A: It is given that the regression equation of 2 explanatory variable and 1 dependent variable is ŷ =…
Q: A study was conducted among a smaple of undergraduate students to find the relationship between the…
A: The independent variable is the number of cups of coffee consumed. The dependent variable is level…
Q: Suppose a data file from a certain study has information for the following variables: 1. Gender-(X1)…
A: Suppose a data file from a certain study has information for the following varaibles: Gender (x1)…
Q: Suppose a least-squares regression line is given by y = 4..302x- 3.293. What is the mean value of…
A: Solution: From the given information, a least squares regression line is
Q: Consider the following econometric model birthweight = Bo+B₁smoking+u where birthweight is a baby's…
A: Consider the following econometric model birthweight = β0 + β1 smoking + u where birthweight is…
Q: Consider the following regression model: Class Average; = Bo + B1 × Office Hours; + u; Class Average…
A: From the given information, the regression model is, Class averagei=β0+β1*Office Hoursi+ui Here, the…
Q: Suppose we run a multiple regression model with 3 predictors, and find the followir summary output…
A: From the given output, The estimate for the variable x1 is 3.5200 From the variance-covariance…
Q: An analyst believes that the only important determinant of banks’ returns on assets (Y) is the ratio…
A: The coefficient of determination lies between 0 and 1. It gives us the strength of relation of X and…
Q: A researcher wishes to build an appropriate multiple linear model for predicting response variable Y…
A: Hi! Thank you for the question, As per the honor code, we are allowed to answer three sub-parts at a…
Q: 3. Consider the following regression model: Weekly Hours = Bo + B1 × Wage + uj Weekly Hours is the…
A: Given information: The regression model is given.
Q: Consider the multiple regression model with three control variables 1, 2, and 13. where these three…
A: We have a multiple linear regression model with the dependent variable y and the independent…
Q: Suppose a least-squares regression line is given by y 4.302x-3.293. What is the mean value of the…
A: It is given that the least-squares regression line is
Q: A logistic regression model was proposed for classifying common brushtail possums into their two…
A: It was stated that a logistic regression model was proposed for dividing common brushtail possums…
Q: a. Develop a correlation matrix. Which independent variable has the strongest correla- tion with the…
A: a) Here, cars sales at last month is the depending variable(Y) and advertising (X1) and sales force…
Q: The table below shows the number of state-registered automatic weapons and the murder rate for…
A: Given information- We have given data in the form of a table that contains, the number of…
Q: A) How many murders per 100,000 residents can be expected in a state with 7 thousand automatic…
A: Given: The model fitted for the data is y=0.86x+3.95
Q: Suppose that George wants to determine if the number of insects in a given area is related to the…
A: we have give that x1=5 ,x2=9 ,x3=10 ,xbar=8 ,sdx=2.646 and y1=17,y2=1,y3=15,ybar=11,sdy=8.718 n=3
Q: Referring to Table 12-11, which of the following is the correct alternative hypothesis for testing…
A: For the given question , The Null Hypothesis would be that there is not a significant relationship…
Q: Obtain the appropriate measure of dispersion for age and both income variables. DATA Subject…
A: Standard deviation (SD) is the most commonly used measure of dispersion. It is a measure of spread…
Q: If you have 4 highly correlated variables the maximum number of principal components which can be…
A: Given: Number of variables = 4
Q: Table 4.13 The Relationship Between the Predictors and the Dependent Variable Model Coefficients-…
A: Given: Regression output
Q: Suppose a least-squares regression line is given by y = 4.302x- 3.293. What is the mean value of the…
A:
Q: Consider the following table of data. 1 1 2 9 y 1 2 1 2 (a) Calculate the least squares line and the…
A: a)
Q: If there is an autocorrelation problem in the Y-A+BX, +BX PX equation, which of the following…
A: Given a regression equation and we have to select option that will not happen in pressenc of…
Q: In a study of the relation between the price (in thousand pounds) (x) and the number of computers…
A: a) Let, x : Price of computer unit (in thousand pounds) y : Number of computers sold monthly…
Q: Consider the following model of the Philips curve. In this model inflation is regressed upon…
A: a) Serial correlation: Serial correlation is the correlation between the variable and its lagged…
Q: Consider the following Model: y = Bo + B₁x₁ + B₂X₂ + ... + BxXx + ε A) With reference to this model,…
A: Since you have posted a question with multiple sub-parts, we will solve first three subparts for…
Q: 1. Consider the following regression model: Fram Risk Score; = Bo + B1 × Health Insurance; + ui The…
A: Given information: The regression model is given.
Q: Prof. Reed is interested in studying the determinants of fertility. She believes that women who…
A: Here we want to determine how much the number of children a woman wants to have predicts her…
Q: TABLE 2.1 Self-Reported Health Regressed on Education, Controlling for Sociodemographic…
A: Regression Slope test : To test the regression slope test for the significant relationship the t…
Q: 1) What is the line of best fit for this data? a. y =-1.11x + 11.83; r=-0.9760964904 Average Speed…
A: Solution: 1. Let X be the Average speed and Y be the Time. The given data is
Q: Which of the following can residual analysis be used for: to test for interactions to test for…
A: Residual analysis is also known as residual plot We know that, * interactions, * multicollinearity…
Q: Calculate the coefficients of variation (CV) for Bartman, Reynolds, and the Winslow 5000. Bartman…
A:
Q: Interpret the following three sets of data using scatter chart and regression analysis, using slope…
A: Let us denote X as the number of cars on the sales lot and Y as the cars sold per day. Excel…
Q: The activities required to service a car at the Exclusive Car Mart is summarised in the following…
A: Note: According to Bartleby's guidelines first three subparts are solved. please upload other parts…
Q: Suppose a least-squares regression line is given by y= 4.302x-3.293. What is the mean value of the…
A: The least-square regression line is ŷ = 4.302x – 3.293.
Q: Consider the following regression model: Weekly Hours = Bo + B1 × Wage + uį Weekly Hours is the…
A: Given information: The regression model is given.
Q: For the following problem, select all answers that are correct. Under certain conditions, minimizing…
A:
Q: A prospective MBA student would like to examine the factors that impact starting salary upon…
A:
Q: he table below shows the number of state-registered automatic weapons and the murder rate for…
A: Given data, X Y X*Y X*X 11.7 14.2 166.14 136.89 8.6 11.5 98.9 73.96 7.1 10 71 50.41 3.5…
Assume that the averages of all factors other than educ have remained constant over time and that the average level of education is 12.2 for the 1972 sample and 13.3 in the 1984 sample.
Using the estimates in Table 13.1, find the estimated change in average fertility between 1972 and 1984. (Be sure to account for the intercept change and the change in average education.)
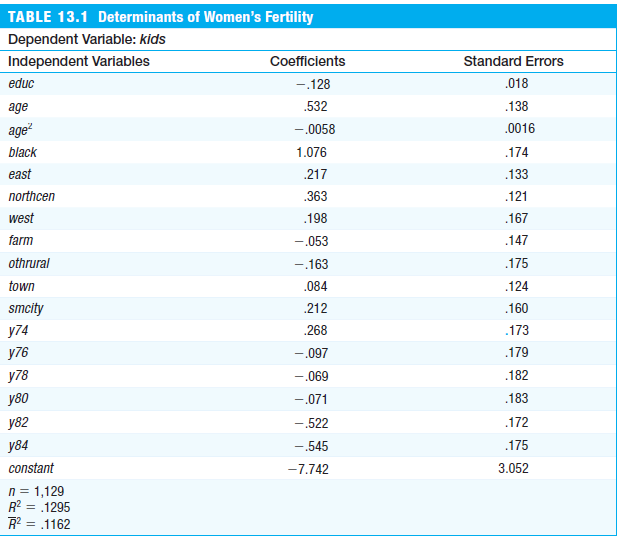
Trending now
This is a popular solution!
Step by step
Solved in 3 steps
- A possible important environmental determinant of lung function in children is the amount of cigarette smoking in the home. Suppose this question is studied by selecting two groups: Group 1 consists of 23 nonsmoking children 5−9 years of age, both of whose parents smoke, who have a mean forced expiratory volume (FEV) of 2.1 L and a standard deviation of 0.7 L; group 2 consists of 20 nonsmoking children of comparable age, neither of whose parents smoke, who have a mean FEV of 2.3 L and a standard deviation of 0.4 L. A) What are the appropriate null and alternative hypotheses to compare the means of the two groups? B) What is the appropriate test procedure for the hypotheses in Problem A? C) Carry out the test in Problem B using the criticalvalue method. D) Provide a 95% CI for the true mean difference in FEV between 5- to 9-year-old children whose parents smoke and comparable children whose parents do not smoke.A possible important environmental determinant of lung function in children is the amount of cigarette smoking in the home. Suppose this question is studied by selecting two groups: Group 1 consists of 23 nonsmoking children 5−9 years of age, both of whose parents smoke, who have a mean forced expiratory volume (FEV) of 2.1 L and a standard deviation of 0.7 L; group 2 consists of 20 nonsmoking children of comparable age, neither of whose parents smoke, who have a mean FEV of 2.3 L and a standard deviation of 0.4 L.8.31 What are the appropriate null and alternative hypotheses to compare the means of the two groups?8.32 What is the appropriate test procedure for the hypotheses in Problem 8.31?8.33 Carry out the test in Problem 8.32 using the criticalvalue method.8.34 Provide a 95% CI for the true mean difference in FEV between 5- to 9-year-old children whose parents smoke and comparable children whose parents do not smoke.8.35 Assuming this is regarded as a pilot study, how many children…A possible important environmental determinant of lung function in children is the amount of cigarette smoking in the home. Suppose this question is studied by selecting two groups: Group 1 consists of 23 nonsmoking children 5−9 years of age, both of whose parents smoke, who have a mean forced expiratory volume (FEV) of 2.1 L and a standard deviation of 0.7 L; group 2 consists of 20 nonsmoking children of comparable age, neither of whose parents smoke, who have a mean FEV of 2.3 L and a standard deviation of 0.4 L. A) Assuming this is regarded as a pilot study, how many children are needed in each group (assuming equal numbers in each group) to have a 95% chance of detecting a significant difference using a two-sided test with α = .05? B) Answer the question in Problem A if the investigators use a one-sided rather than a two-sided test. Suppose 40 children, both of whose parents smoke, and 50 children, neither of whose parents smoke, are recruited for the study. C) How much power would…
- A possible important environmental determinant of lung function in children is the amount of cigarette smoking in the home. Suppose this question is studied by selecting two groups: Group 1 consists of 23 nonsmoking children 5−9 years of age, both of whose parents smoke, who have a mean forced expiratory volume (FEV) of 2.1 L and a standard deviation of 0.7 L; group 2 consists of 20 nonsmoking children of comparable age, neither of whose parents smoke, who have a mean FEV of 2.3 L and a standard deviation of 0.4 L. Suppose 40 children, both of whose parents smoke, and50 children, neither of whose parents smoke, are recruitedfor the study.*8.37 How much power would such a study have using atwo-sided test with significance level = .05, assuming thatthe estimates of the population parameters in the pilot studyare correct?*8.38 Answer Problem 8.37 assuming a one-sided ratherthan a two-sided test is used.A possible important environmental determinant of lung function in children is the amount of cigarette smoking in the home. Suppose this question is studied by selecting two groups: Group 1 consists of 23 nonsmoking children 5-9 years of age, both of whose parents smoke, who have a mean forced expiratory volume (FEV) of 2.1 L and a standard deviation of 0.7 L; group 2 consists of 20 nonsmoking children of comparable age, neither of whose parents smoke, who have a mean FEV of 2.3 L and a standard deviation of 0.4 L.*8.31 What are the appropriate null and alternative hypotheses to compare the means of the two groups? *8.32 What is the appropriate test procedure for the hypotheses in Problem 8.31? *8.33 Carry out the test in Problem 8.32 using the criticalvalue method. *8.34 Provide a 95% CI for the true mean difference in FEV between 5- to 9-year-old children whose parents smoke and comparable children whose parents do not smoke. *8.35 Assuming this is regarded as a pilot study, how many…Suppose a researcher believes that the occurrence of natural disasters such as earthquakes leads to increased activity in the construction industry. he decides to collect province-level data on employment in the construction industry of an earthquake-prone country, like Japan, and regress this variable on an indicator variable that equals 1 if an earthquake took place in that province in the last five years. a. Should the researcher include province fixed effects in order to control for location specific characteristics of the labor market? b. What can the researcher to control for the location effects?
- Suppose that X represents the number of years a person goes to school, and Y represents the income they earn after finishing those years of school. Years of schooling is widely believed to be a major determinant of income. The correlation between education and earnings is positive. Explain whether this correlation is likely to be causal or not.Note- bolded quiz have already answered A possible important environmental determinant of lung function in children is the amount of cigarette smoking in the home. Suppose this question is studied by selecting two groups: Group 1 consists of 23 nonsmoking children 5-9 years of age, both of whose parents smoke, who have a mean forced expiratory volume (FEV) of 2.1 L and a standard deviation of 0.7 L; group 2 consists of 20 nonsmoking children of comparable age, neither of whose parents smoke, who have a mean FEV of 2.3 L and a standard deviation of 0.4 L.*8.31 What are the appropriate null and alternative hypotheses to compare the means of the two groups? *8.32 What is the appropriate test procedure for the hypotheses in Problem 8.31? *8.33 Carry out the test in Problem 8.32 using the criticalvalue method. *8.34 Provide a 95% CI for the true mean difference in FEV between 5- to 9-year-old children whose parents smoke and comparable children whose parents do not smoke. *8.35 Assuming…Which scatterplot shows a nonlinear association?
- The hourly wages of a sample of 130 system analysts are given belowmean=60mode=73median=74range=20variance=324The coefficient of variation equals...?A survey of 750 likely voters in Ohio was conducted by the Rasmussen Poll just prior tothe general election (Rasmussen Reports website, November 4, 2012). The state of theeconomy was thought to be an important determinant of how people would vote. Amongother things, the survey found that 165 of the respondents rated the economy as good orexcellent and 315 rated the economy as poor.a. Develop a point estimate of the proportion of likely voters in Ohio who rated theeconomy as good or excellent.b. Construct a 95% confidence interval for the proportion of likely voters in Ohio whorated the economy as good or excellent.c. Construct a 95% confidence interval for the proportion of likely voters in Ohio whorated the economy as poor.A survey of 750 likely voters in Ohio was conducted by the Rasmussen Poll just prior tothe general election (Rasmussen Reports website, November 4, 2012). The state of theeconomy was thought to be an important determinant of how people would vote. Amongother things, the survey found that 165 of the respondents rated the economy as good orexcellent and 315 rated the economy as poor.a. Develop a point estimate of the proportion of likely voters in Ohio who rated theeconomy as good or excellent.b. Construct a 95% confidence interval for the proportion of likely voters in Ohio whorated the economy as good or excellent