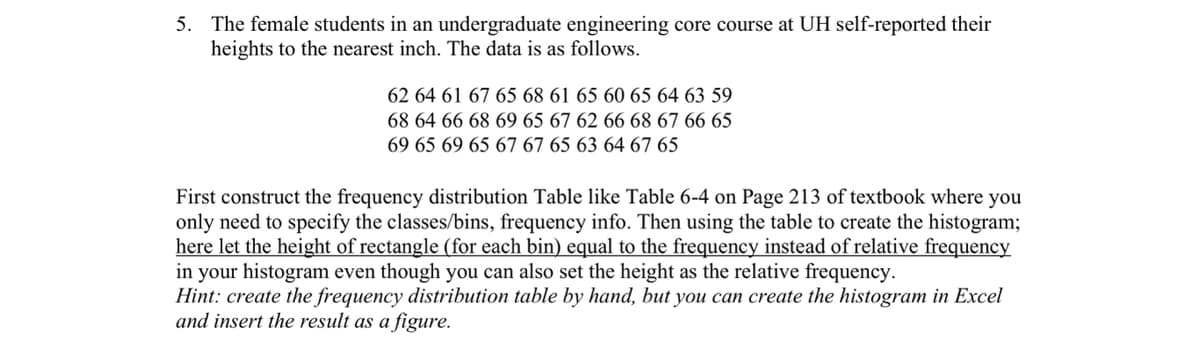
5. The female students in an undergraduate engineering core course at UH self-reported their heights to the nearest inch. The data is as follows. 62 64 61 67 65 68 61 65 60 65 64 63 59 68 64 66 68 69 65 67 62 66 68 67 66 65 69 65 69 65 67 67 65 63 64 67 65 First construct the frequency distribution Table like Table 6-4 on Page 213 of textbook where you only need to specify the classes/bins, frequency info. Then using the table to create the histogram; here let the height of rectangle (for each bin) equal to the frequency instead of relative frequency in your histogram even though you can also set the height as the relative frequency. Hint: create the frequency distribution table by hand, but you can create the histogram in Excel and insert the result as a figure.
5. The female students in an undergraduate engineering core course at UH self-reported their heights to the nearest inch. The data is as follows. 62 64 61 67 65 68 61 65 60 65 64 63 59 68 64 66 68 69 65 67 62 66 68 67 66 65 69 65 69 65 67 67 65 63 64 67 65 First construct the frequency distribution Table like Table 6-4 on Page 213 of textbook where you only need to specify the classes/bins, frequency info. Then using the table to create the histogram; here let the height of rectangle (for each bin) equal to the frequency instead of relative frequency in your histogram even though you can also set the height as the relative frequency. Hint: create the frequency distribution table by hand, but you can create the histogram in Excel and insert the result as a figure.

Glencoe Algebra 1, Student Edition, 9780079039897, 0079039898, 2018
18th Edition
ISBN:9780079039897
Author:Carter
Publisher:Carter
Chapter10: Statistics
Section10.6: Summarizing Categorical Data
Problem 23PPS

Related questions
Question
Transcribed Image Text:5. The female students in an undergraduate engineering core course at UH self-reported their
heights to the nearest inch. The data is as follows.
62 64 61 67 65 68 61 65 60 65 64 63 59
68 64 66 68 69 65 67 62 66 68 67 66 65
69 65 69 65 67 67 65 63 64 67 65
First construct the frequency distribution Table like Table 6-4 on Page 213 of textbook where you
only need to specify the classes/bins, frequency info. Then using the table to create the histogram;
here let the height of rectangle (for each bin) equal to the frequency instead of relative frequency
in your histogram even though you can also set the height as the relative frequency.
Hint: create the frequency distribution table by hand, but you can create the histogram in Excel
and insert the result as a figure.
Expert Solution
This question has been solved!
Explore an expertly crafted, step-by-step solution for a thorough understanding of key concepts.

This is a popular solution!

Trending now
This is a popular solution!

Step by step
Solved in 4 steps with 3 images

Recommended textbooks for you
Glencoe Algebra 1, Student Edition, 9780079039897…
Algebra
ISBN:
9780079039897
Author:
Carter
Publisher:
McGraw Hill
Glencoe Algebra 1, Student Edition, 9780079039897…
Algebra
ISBN:
9780079039897
Author:
Carter
Publisher:
McGraw Hill