5. Use Walmart's condensed financial statements on Canvas to compute its inventory turnover ratios for 2021 and 2022. Which of the following is correct regarding Walmart's inventory liquidity? (a) Walmart's inventory liquidity in 2021 was higher than in 2022. O (d) Walmart's inventory liquidity in 2022 was higher than in 2021. O (c) Walmart's inventory liquidity is the same in 2021 and 2022. O (d) There is insufficient information to compute Walmart's inventory liquidity.
5. Use Walmart's condensed financial statements on Canvas to compute its inventory turnover ratios for 2021 and 2022. Which of the following is correct regarding Walmart's inventory liquidity? (a) Walmart's inventory liquidity in 2021 was higher than in 2022. O (d) Walmart's inventory liquidity in 2022 was higher than in 2021. O (c) Walmart's inventory liquidity is the same in 2021 and 2022. O (d) There is insufficient information to compute Walmart's inventory liquidity.

Cornerstones of Financial Accounting
4th Edition
ISBN:9781337690881
Author:Jay Rich, Jeff Jones
Publisher:Jay Rich, Jeff Jones
Chapter12: Fainancial Statement Analysis
Section: Chapter Questions
Problem 13MCQ

Related questions
Question
V6
Transcribed Image Text:Question 5
2.5 pts
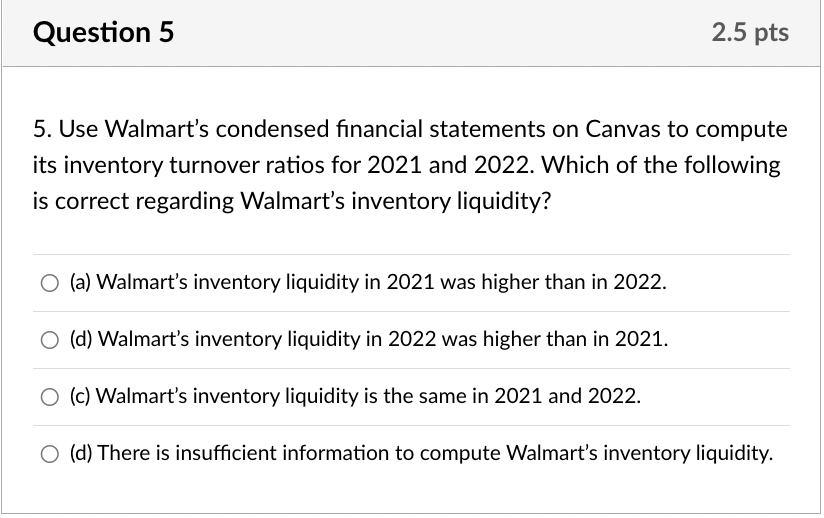
5. Use Walmart's condensed financial statements on Canvas to compute
its inventory turnover ratios for 2021 and 2022. Which of the following
is correct regarding Walmart's inventory liquidity?
O (a) Walmart's inventory liquidity in 2021 was higher than in 2022.
O (d) Walmart's inventory liquidity in 2022 was higher than in 2021.
O (c) Walmart's inventory liquidity is the same in 2021 and 2022.
O (d) There is insufficient information to compute Walmart's inventory liquidity.
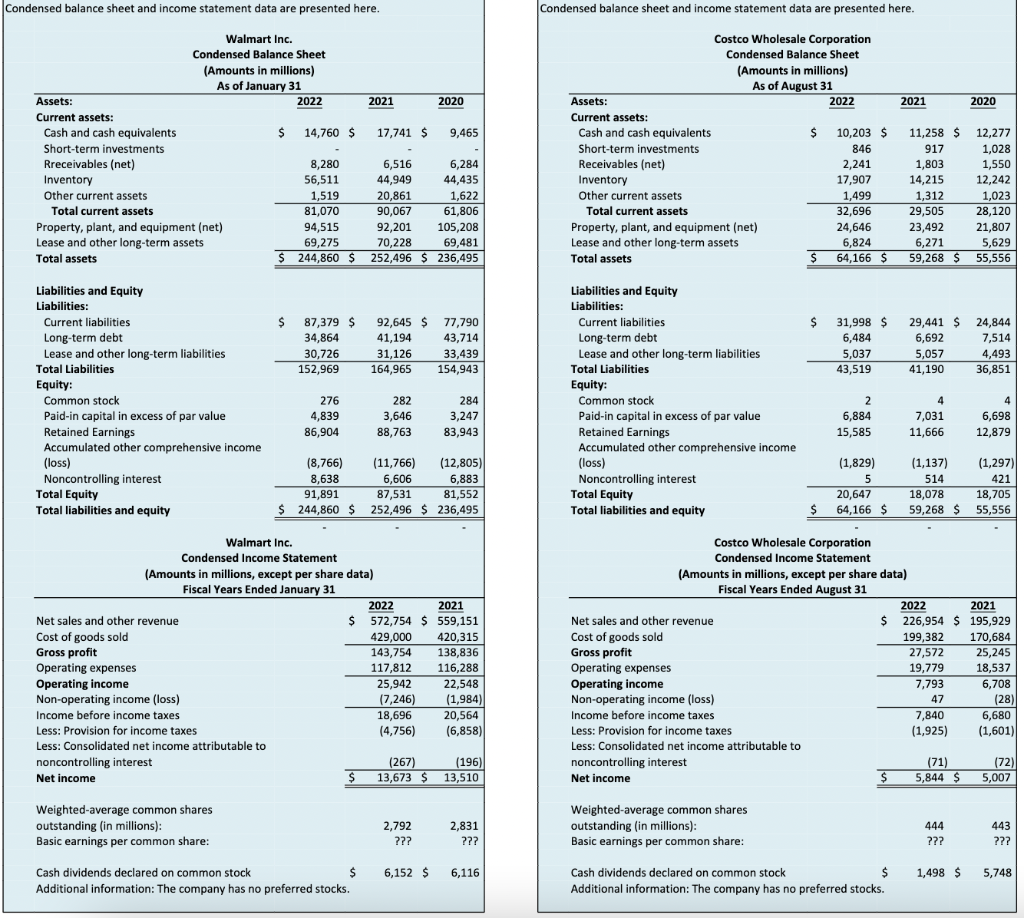
Transcribed Image Text:Condensed balance sheet and income statement data are presented here.
Assets:
Current assets:
Cash and cash equivalents
Short-term investments
Rreceivables (net)
Inventory
Other current assets
Total current assets
Property, plant, and equipment (net)
Lease and other long-term assets
Total assets
Liabilities and Equity
Liabilities:
Current liabilities
Long-term debt
Lease and other long-term liabilities
Total Liabilities
Equity:
Common stock
Paid-in capital in excess of par value
Retained Earnings
Accumulated other comprehensive income
(loss)
Noncontrolling interest
Total Equity
Total liabilities and equity
Walmart Inc.
Condensed Balance Sheet
(Amounts in millions)
As of January 31
Net sales and other revenue
Cost of goods sold
Gross profit
Operating expenses
Operating income
Non-operating income (loss)
Income before income taxes
Less: Provision for income taxes
Less: Consolidated net income attributable to
noncontrolling interest
Net income
$
Weighted-average common shares
outstanding (in millions):
Basic earnings per common share:
2022
$
14,760 $
8,280
56,511
1,519
81,070
87,379 $
34,864
30,726
152,969
276
4,839
86,904
(8,766)
8,638
Walmart Inc.
Condensed Income Statement
(Amounts in millions, except per share data)
Fiscal Years Ended January 31
2021
94,515
92,201
105,208
69,275
70,228
69,481
$ 244,860 $ 252,496 $ 236,495
17,741 $
6,516
44,949
20,861
90,067
$
Cash dividends declared on common stock
Additional information: The company has no preferred stocks.
31,126
164,965
282
3,646
88,763
2020
92,645 $ 77,790
41,194
43,714
33,439
154,943
9,465
(11,766)
6,606
(12,805)
6,883
91,891
87,531
81,552
$ 244,860 $ 252,496 $ 236,495
6,284
44,435
1,622
61,806
2,792
???
284
3,247
83,943
2022
2021
$ 572,754 $ 559,151
429,000 420,315
143,754 138,836
117,812
116,288
25,942
22,548
(7,246)
(1,984)
18,696
(4,756)
(267)
(196)
$ 13,673 $13,510
20,564
(6,858)
2,831
???
6,152 $ 6,116
Condensed balance sheet and income statement data are presented here.
Assets:
Current assets:
Cash and cash equivalents
Short-term investments
Receivables (net)
Inventory
Costco Wholesale Corporation
Condensed Balance Sheet
(Amounts in millions)
As of August 31
2022
Other current assets
Total current assets
Property, plant, and equipment (net)
Lease and other long-term assets
Total assets
Liabilities and Equity
Liabilities:
Current liabilities
Long-term debt
Lease and other long-term liabilities
Total Liabilities
Equity:
Common stock
Paid-in capital in excess of par value
Retained Earnings
Accumulated other comprehensive income
(loss)
Noncontrolling interest
Total Equity
Total liabilities and equity
Operating expenses
Operating income
Net sales and other revenue
Cost of goods sold
Gross profit
$
Non-operating income (loss)
Income before income taxes
mcon
Less: Provision for income taxes
Less: Consolidated net income attributable to
noncontrolling interest
Net income
$
Weighted-average common shares
outstanding (in millions):
Basic earnings per common share:
$
$
10,203 $
846
2,241
17,907
1,499
32,696
24,646
6,824
64,166 $
31,998 $
6,484
5,037
43,519
2
6,884
15,585
(1,829)
5
Costco Wholesale Corporation
Condensed Income Statement
20,647
64,166 $
(Amounts in millions, except per share data)
Fiscal Years Ended August 31
2021
$
$
Cash dividends declared on common stock
Additional information: The company has no preferred stocks.
11,258 $ 12,277
917
1,028
1,803
1,550
12,242
1,023
28,120
21,807
5,629
55,556
14,215
1,312
29,505
23,492
6,271
59,268 $
29,441 $
6,692
5,057
41,190
4
7,031
11,666
(1,137)
514
(1,297)
421
18,705
59,268 $ 55,556
18,078
2022
2021
$ 226,954 $ 195,929
199,382 170,684
27,572
19,779
7,793
47
7,840
(1,925)
(71)
5,844 $
2020
444
???
24,844
7,514
4,493
36,851
1,498 $
4
6,698
12,879
25,245
18,537
6,708
(28)
6,680
(1,601)
(72)
5,007
443
???
5,748
Expert Solution
This question has been solved!
Explore an expertly crafted, step-by-step solution for a thorough understanding of key concepts.

Step by step
Solved in 3 steps

Knowledge Booster


Learn more about
Need a deep-dive on the concept behind this application? Look no further. Learn more about this topic, accounting and related others by exploring similar questions and additional content below.Recommended textbooks for you
Cornerstones of Financial Accounting
Accounting
ISBN:
9781337690881
Author:
Jay Rich, Jeff Jones
Publisher:
Cengage Learning

Financial Accounting: The Impact on Decision Make…
Accounting
ISBN:
9781305654174
Author:
Gary A. Porter, Curtis L. Norton
Publisher:
Cengage Learning

Managerial Accounting
Accounting
ISBN:
9781337912020
Author:
Carl Warren, Ph.d. Cma William B. Tayler
Publisher:
South-Western College Pub
Cornerstones of Financial Accounting
Accounting
ISBN:
9781337690881
Author:
Jay Rich, Jeff Jones
Publisher:
Cengage Learning
Financial Accounting: The Impact on Decision Make…
Accounting
ISBN:
9781305654174
Author:
Gary A. Porter, Curtis L. Norton
Publisher:
Cengage Learning
Managerial Accounting
Accounting
ISBN:
9781337912020
Author:
Carl Warren, Ph.d. Cma William B. Tayler
Publisher:
South-Western College Pub

Financial And Managerial Accounting
Accounting
ISBN:
9781337902663
Author:
WARREN, Carl S.
Publisher:
Cengage Learning,

Intermediate Accounting: Reporting And Analysis
Accounting
ISBN:
9781337788281
Author:
James M. Wahlen, Jefferson P. Jones, Donald Pagach
Publisher:
Cengage Learning