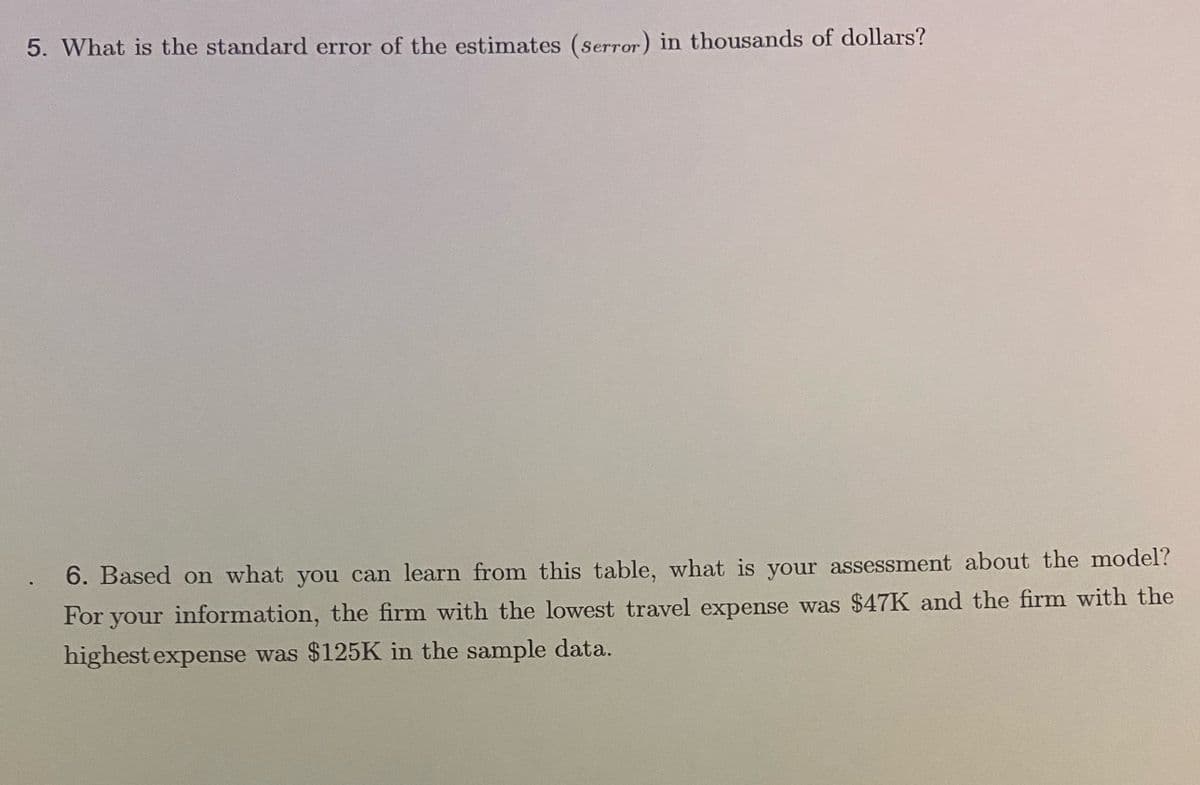
5. What is the standard error of the estimates (Serror) in thousands of dollars?

College Algebra
7th Edition
ISBN:9781305115545
Author:James Stewart, Lothar Redlin, Saleem Watson
Publisher:James Stewart, Lothar Redlin, Saleem Watson
Chapter1: Equations And Graphs
Section: Chapter Questions
Problem 10T: Olympic Pole Vault The graph in Figure 7 indicates that in recent years the winning Olympic men’s...

Related questions
Question
Transcribed Image Text:5. What is the standard error of the estimates (Serror) in thousands of dollars?
6. Based on what you can learn from this table, what is your assessment about the model?
For your information, the firm with the lowest travel expense was $47K and the firm with the
highest expense was $125K in the sample data.
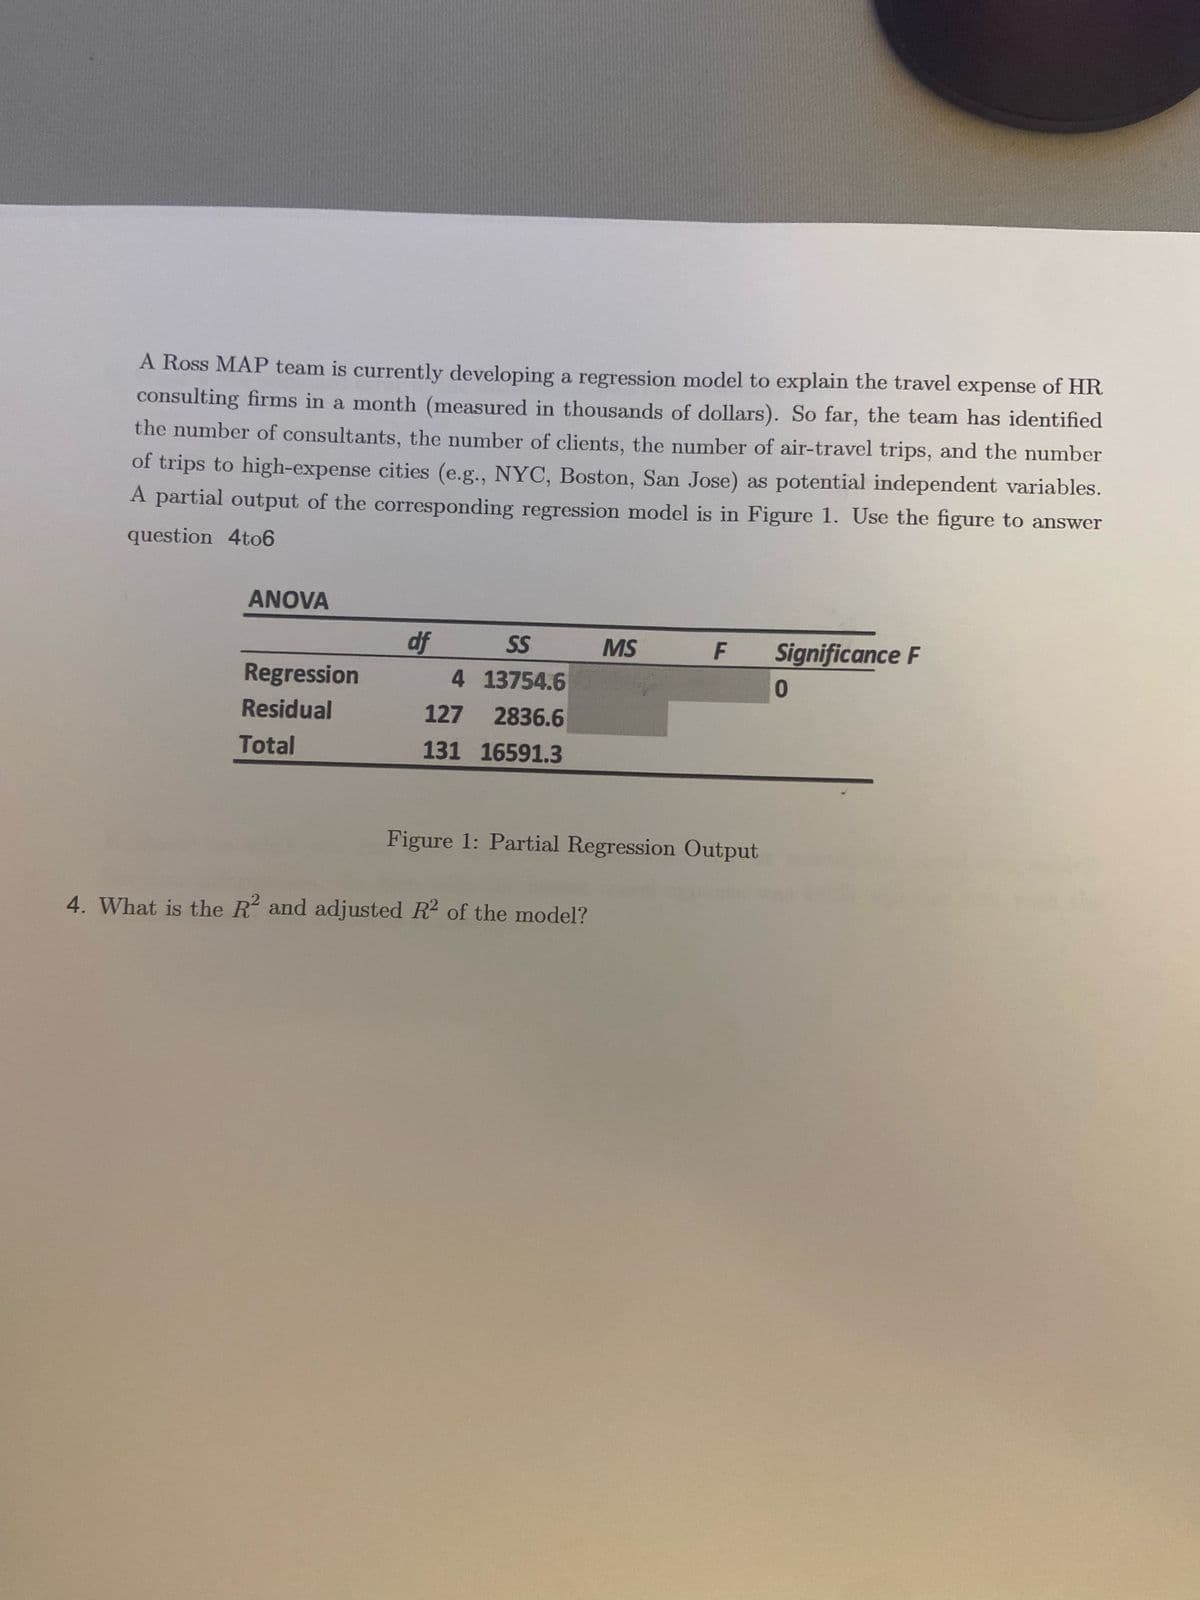
Transcribed Image Text:A Ross MAP team is currently developing a regression model to explain the travel expense of HR
consulting firms in a month (measured in thousands of dollars). So far, the team has identified
the number of consultants, the number of clients, the number of air-travel trips, and the number
of trips to high-expense cities (e.g., NYC, Boston, San Jose) as potential independent variables.
A partial output of the corresponding regression model is in Figure 1. Use the figure to answer
question 4to6
ANOVA
df
SS
MS
F
Significance F
Regression
4 13754.6
0.
Residual
127
2836.6
Total
131 16591.3
Figure 1: Partial Regression Output
4. What is the R and adjusted R2 of the model?
Expert Solution
This question has been solved!
Explore an expertly crafted, step-by-step solution for a thorough understanding of key concepts.

This is a popular solution!

Trending now
This is a popular solution!

Step by step
Solved in 2 steps

Recommended textbooks for you
College Algebra
Algebra
ISBN:
9781305115545
Author:
James Stewart, Lothar Redlin, Saleem Watson
Publisher:
Cengage Learning

Linear Algebra: A Modern Introduction
Algebra
ISBN:
9781285463247
Author:
David Poole
Publisher:
Cengage Learning
College Algebra
Algebra
ISBN:
9781305115545
Author:
James Stewart, Lothar Redlin, Saleem Watson
Publisher:
Cengage Learning
Linear Algebra: A Modern Introduction
Algebra
ISBN:
9781285463247
Author:
David Poole
Publisher:
Cengage Learning