5. Your firm produces car oil-pan gaskets. The machine used typically produces 98% (.98) that are good, and 2% (.02) that are defective. Your quality control representative takes 400 samples per day. Today, the percentage of "good" gaskets is 97.5% (.975). His instructions are to close the plant down if his quality control test shows that the default rate is more than 2% with a significance level of 10%. If there is not evidence at that significance level he is to let the plant continue operations. Do the hypothesis test to determine if he should shut the plant down.
5. Your firm produces car oil-pan gaskets. The machine used typically produces 98% (.98) that are good, and 2% (.02) that are defective. Your quality control representative takes 400 samples per day. Today, the percentage of "good" gaskets is 97.5% (.975). His instructions are to close the plant down if his quality control test shows that the default rate is more than 2% with a significance level of 10%. If there is not evidence at that significance level he is to let the plant continue operations. Do the hypothesis test to determine if he should shut the plant down.

Glencoe Algebra 1, Student Edition, 9780079039897, 0079039898, 2018
18th Edition
ISBN:9780079039897
Author:Carter
Publisher:Carter
Chapter10: Statistics
Section10.6: Summarizing Categorical Data
Problem 30PPS

Related questions
Question
Help with number 5
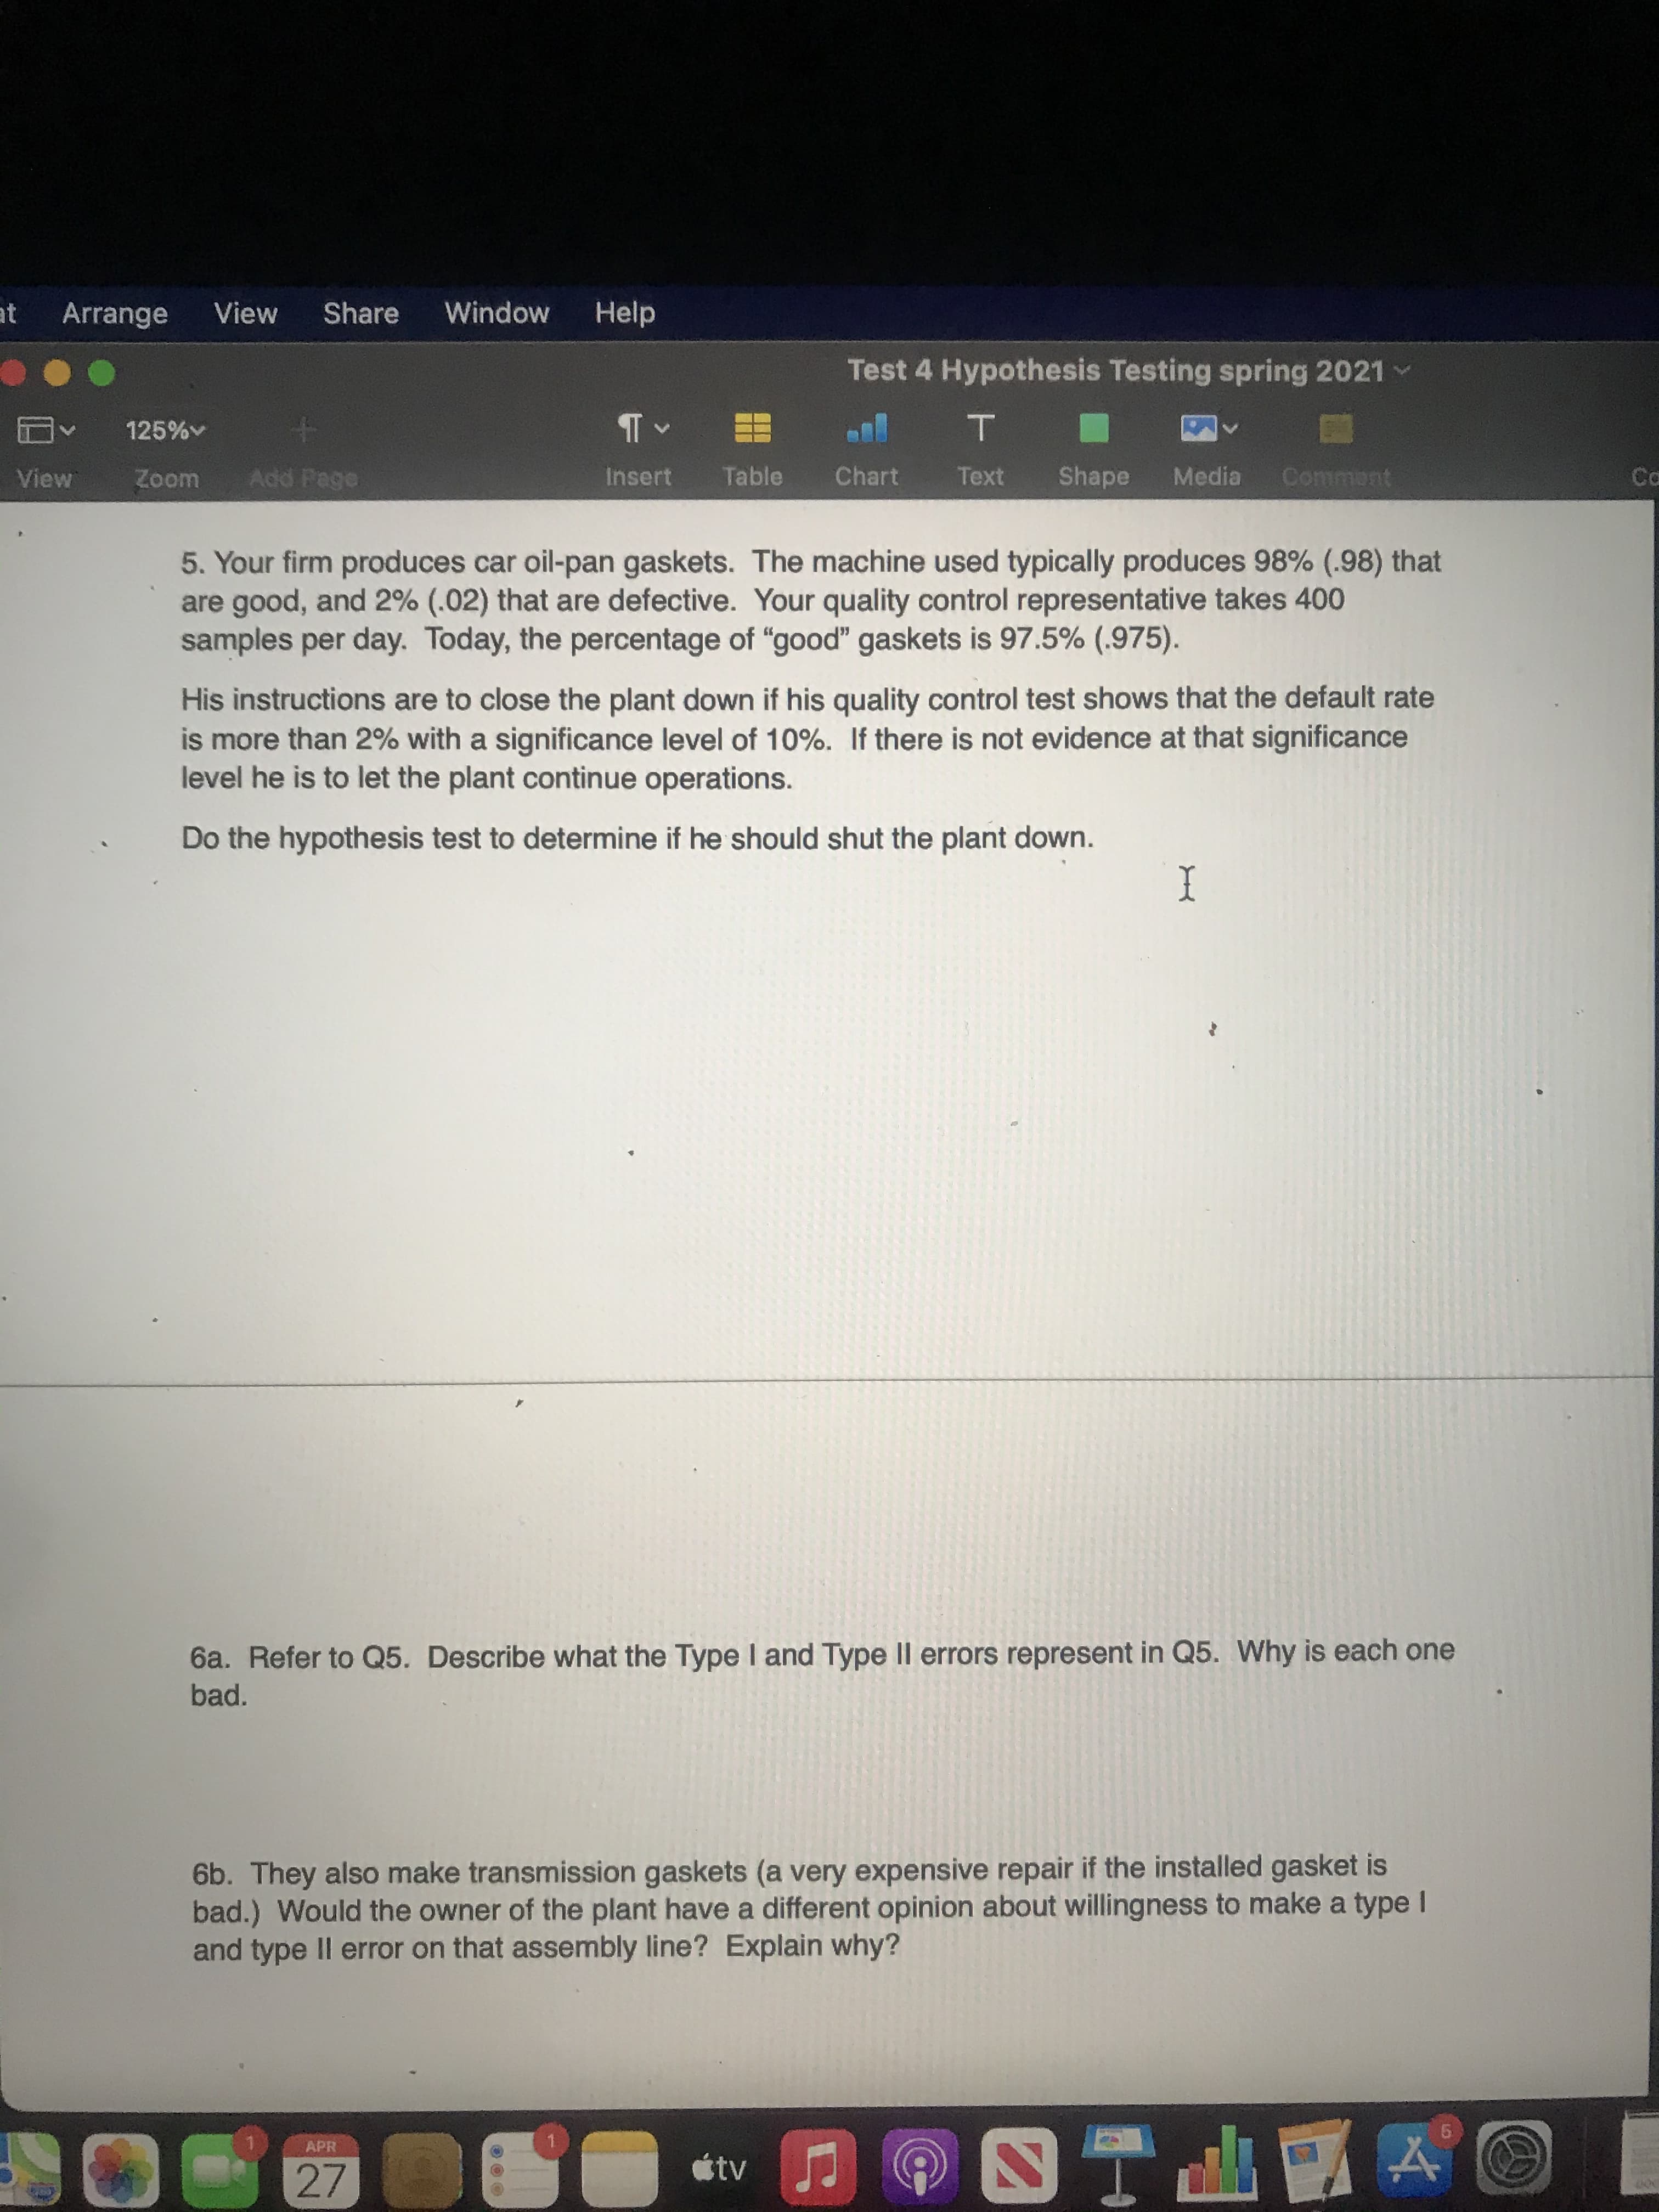
Transcribed Image Text:5. Your firm produces car oil-pan gaskets. The machine used typically produces 98% (.98) that
are good, and 2% (.02) that are defective. Your quality control representative takes 400
samples per day. Today, the percentage of "good" gaskets is 97.5% (.975).
His instructions are to close the plant down if his quality control test shows that the default rate
is more than 2% with a significance level of 10%. If there is not evidence at that significance
level he is to let the plant continue operations.
Do the hypothesis test to determine if he should shut the plant down.
Expert Solution
This question has been solved!
Explore an expertly crafted, step-by-step solution for a thorough understanding of key concepts.

Step by step
Solved in 3 steps with 1 images

Knowledge Booster


Learn more about
Need a deep-dive on the concept behind this application? Look no further. Learn more about this topic, statistics and related others by exploring similar questions and additional content below.Recommended textbooks for you
Glencoe Algebra 1, Student Edition, 9780079039897…
Algebra
ISBN:
9780079039897
Author:
Carter
Publisher:
McGraw Hill
Glencoe Algebra 1, Student Edition, 9780079039897…
Algebra
ISBN:
9780079039897
Author:
Carter
Publisher:
McGraw Hill