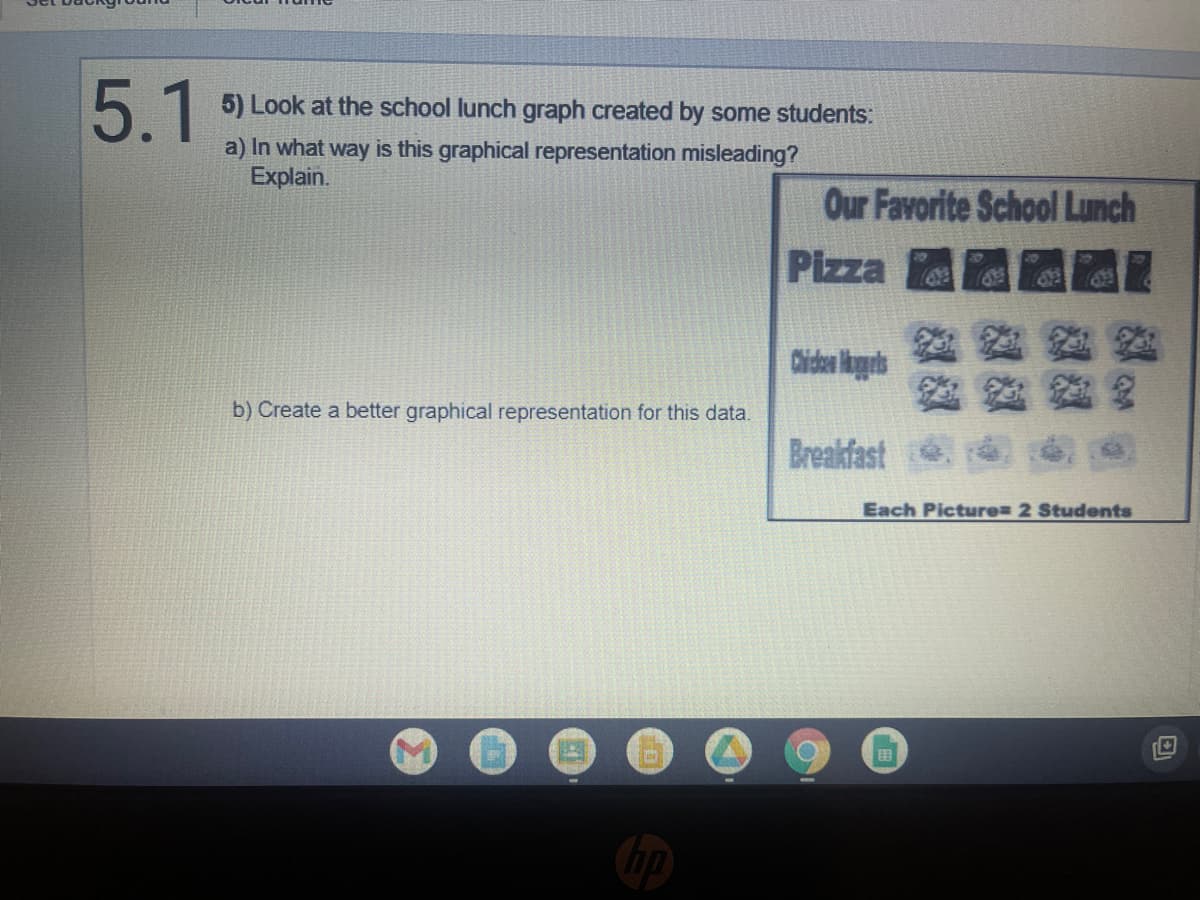
5.1 5) Look at the school lunch graph created by some students: a) In what way is this graphical representation misleading? Explain. b) Create a better graphical representation for this data. Our Favorite School Lunch Pizza Breakfast


Q: wel (1) Pr( first = black, second = white ) = x3 = 18 = 3 (2) Pr( both are black ) = Pr(1st = black,…
A: Since you have posted a question with multiple subparts, we will solve first three subparts for you.…
Q: On what situations in chance experiments can the following probability distributions be used?…
A: The answer is below,
Q: Let X ~ N(0, 1). For any € > 0, show that P(|X| > c) ≤ ²c - ??
A: Note: Hi there! Thank you for posting the question. As you have posted multiple questions, as per…
Q: In a buffet, there are 4 choices of appetizers, 5 choices for the main dish, and 3 choices for the…
A: The answer is attached below,
Q: The stock of a warehouse consists of boxes of high, medium and low quality lightbulbs in respective…
A: Let High (H), Medium (M), Low (L), Satisfactory (S) P(H) = 1/5 = 0.2 P(M) = 2/5 = 0.4 P(L) = 2/5 =…
Q: Let {W} be an SBM. Define the process {B} on the time interval [0, 1] by Bt = Wt-tW₁.
A:
Q: %3A%5B 102NFUME2cpXCYPMbxYU5eL4ucBLHIBQ"%5D%2C"action"%3A"open"%2C"userld"%3A" 109893153201596... C…
A:
Q: QUESTION 3 A manager wishes to simulate 10 days of operation of an inventory system. The beginning…
A:
Q: Identifying Appropriate Test Statistic o is known z-test When the value of sample size (n)... n< 30…
A: Given a flow chart. We have to identify the appropriate test statistic.
Q: Let 0 denote the probability that a randomly sampled individual in some population voted…
A:
Q: An electrical appliance made by company A has an average life of 2500 hours, with a standard…
A:
Q: 4. Find which of the following graphs are bipartite. Redraw the bipartite graphs so that their…
A:
Q: Directions: Use the frequency distribution to look for the following: Scores Frequency Lower…
A: Give data is Scores Frequency Lower Boundaries (LB) <cf 95-99 4 94.5 35 90-94 8 89.5 31…
Q: Amount of claim (to the nearest $50,000) Probability SO The table shows claims and their…
A:
Q: QUESTION Consider the following payoff Table The State of Nature Decision Alternative 0.77 1-0.77-…
A:
Q: Exercise 9: The random variable X has a binomial distribution with n = 10 and p = 0.5. Determine the…
A: Since you have posted a question with multiple sub-parts, we will solve first three sub- parts for…
Q: (a) Find the expected' frequencies for each combination of forecast rainfall and observed rainfall…
A: here use given Table and Calculate Chi -square
Q: A random variable X has cumulative distribution function F given in the following graph: → X -2 -1 1…
A: Since you have posted a question with multiple subparts, we will solve first 3 sub-parts for you…
Q: Members of the student government are planning a movie night on campus. They have asked a random…
A:
Q: (f(x) is a probability density function? (= 0.111 ( Q4/ the value of the constant which makes the…
A:
Q: (1) Convert 10 dollars to "widgets". (1 dollar 1.74 widgets)
A: Given that Convert into 10 dollars to widgets. NOTE:- According to bartleby guidelines expert can…
Q: manufacturer has a recently produced a batch of 17 smart phones. Unknown to them, 6 of these phones…
A: Given 17 batch smartbphones 6 are defective
Q: A population is described by the probability distribution 2 -1 1 2 f(z) 0.5 0.25 0.25 Let X₁ and X₂…
A:
Q: Marvin is deciding a path from three (3) routes to reach = Village C (he is at Village A): A → Bk →…
A: From the given information, There are 3 routes. A→Bk→C for k=1,2,3 p1=0.4, p2=0.3, p3=0.3 The path…
Q: This answers A-C. I need help with D-G
A: In the given scenario, we need to find out the statistic, sampling method, response rate, and…
Q: Directions: FACT or BLUFF. Write the word FACT if the situation states the truth and BLUFF if it is…
A:
Q: 1. The number of typing errors on a page follows a Poisson distribution with a mean of 6.3. Find the…
A:
Q: Is given in th
A: The most repeating games used by the researchers that can be played quickly. It is discovered that…
Q: 1 (a) On a particular day a random sample of 12 tins of peas is taken from the output of a canning…
A:
Q: Exercise 6: Product codes of two, three, four, or five letters are equally likely. W mean and…
A: Given, The product codes of two, three, four, or five letters are equally likely. Hence the P(x) =…
Q: 3. Assume that the wait time to see your family doctor is uniformly distribution been 10 and 30…
A: It is given that the wait time follows uniform distribution with a=10 and b=30.
Q: a) What is the probability distribution of B₁? (b) Briefly explain why P(B₁ = 0) = 1. (c) At what…
A:
Q: Estimate the linear model and use an analysis-of-variance approach to test the hypothesis that B1 =…
A:
Q: Three dice were rolled. Find the probability of getting a number less than 10 if it is known that…
A:
Q: If you choose two numbers from 1 to 67, what is the probability that one number is greater than…
A:
Q: 11. Suppose Google creates a new workspace in Toronto. The building operates with 1,200 computers.…
A: Given that, google creates a new workspace in Toronto. The building operates with 1,200 computers.…
Q: (a) Find the probability that a randomly selected toothbrush (of this type) has a lifespan of more…
A: Solution The given distribution is a continuous probability distribution function.
Q: QUESTION 16 The computer center at Rock bottom University has been experiencing computer downtime.…
A:
Q: A team composed of two grade 11 and two grade 10 students is to be sent to a debate contest. If…
A: The provided information is There are Two grade 11 and two grade 10 students There are also 60…
Q: 6. Suppose that a random walk S₂ (in some graph/environment, such as Zd, but not necessarily) is…
A: Given that, Sn is a random walk is recurrent when started from position x. P∃n≥1, Sn=x|S0=x=1
Q: Given the plot of normal distributions A and B below, which of the following statements is true?…
A:
Q: sallys teacher created a math problem, but she colored the marbles with invisible ink! please help…
A: Given : probability of landing on green and choosing a blue marble = 5/21
Q: is the process of selecting from among a group of theoretically possible alternatives of those…
A: Denoting is the process of selecting from among of theoretically possible alternatives of those…
Q: A 24. If you throw a ball at a rectangular board that is 4 ft. by 5 ft. with a smaller 2 ft. by 2…
A: Area of rectangle = length ×breadth Area of square = side2
Q: Fill in the correct data being asked. SIMPLE/SINGLE TOSS The following are obtained results from…
A:
Q: (a) Find the probabilities of the events below. Write each answer as a single fraction. P(A) = || P…
A: here Given , there are total 11 students in sample space A = event that student is in the spanish…
Q: Class Interval 1. 38 married females of Barangay GTDL of Valenzuela City were asked about their…
A: we have given data are…
Q: This exercise assumes familiarity with counting arguments and probability (see Probability and…
A: According to the given information, we have Number of green knapsacks = 8 Number of yellow knapsacks…
Q: Frank is playing a game in which he spins a spinner with 6 equal-sized slices numbered 1 through 6.…
A:
Q: What is the probability that the student is male ME student or an EE student? B. What is the…
A: Here here make Table for given situation

Step by step
Solved in 2 steps with 1 images

- A survey regarding height (in cm) of 60 boys belonging to BBA program at JGBS l was conducted. The following data was recorded. Height in cm Frequency 150-155 4 155-160 8 160-165 5 165-170 7 170-175 11 175-180 20 180-185 5 Student having height more than 170 is considered as tall student. a) Use appropriate graph to answer the following questions: b) Number of students having height > 165 c) Number of students having height more than 155 d) Total tall students in class. e) Median using graphical method Note- answer all parts of the questionIn a poll, a random sample of 2163 adults (aged 18 and over) was asked, "When you see an ad emphasizing that a product is made in your country, are you more likely to buy it, less likely to buy it, or neither more nor less likely to buy it?" The results of the survey are presented in the side-by-side graph. Complete parts (a) through (d) below. (a) What proportion of 18- to 34-year-old respondents are more likely to buy when made in their country? What proportion of 35- to 44-year-old respondents are more likely to buy when made in their country? The proportion of 18- to 34-year-old respondents is enter your response here. The proportion of 35- to 44-year-old respondents is enter your response here. Part 2 (b) What age group has the greatest proportion who are more likely to buy when made in their country? A. 55+ yrs B. 35-44 yrs C. 18-34 yrs D. 45-54 yrs Part 3 (c) Which age group has a majority of respondents who…A survey regarding height (in cm) of 60 boys belonging to BBA program at JGBS l was conducted. The following data was recorded. Height in cm Frequency 150-155 4 155-160 8 160-165 5 165-170 7 170-175 11 175-180 20 180-185 5 Student having height more than 170 is considered as tall student. Use appropriate graph to answer following questions: (5) Number of students having height > 165 (1) Number of students having height more than 155 (1) Total tall students in class. (1) Median using graphical method (2)
- In a poll, a random sample of 2163 adults aged 18 and over was asked, “When you see an ad emphasizing that a product is made in your country, are you likely to buy it, less likely to buy it, or neither more nor less likely to buy it?”. The results of the survey are presented in the side by side graph.Draw the appropriate graph for each of the data sets given below and give a short interpretation of your graphsMy data sets were given in one of two pictures which I sent
- Consider lines A and B to be possible fit lines for the data set shown belowIn one region it was found that 28% of people with incomes less than $50,000 use the Internet; 48% of those with incomes between $50,000 to $74,999 use the Internet; and 70% of those with incomes of at least $75,000 use the Internet. Use a pie chart or a bar chart to plot this data.A sociologist was hired by a large city hospital to investigate the relationship between the number of unauthorized days that employees are absent per year and the distance(miles) between home and work for the employee. A sample of 10 employees was chosen, and the following data were collected.
- Draw the appropriate graph for each of the data sets given below. Explain the chosen graphs and give a short interpretationDoes the data presented in the graph indicate that scrub jays choose mates randomly or that they choose mates with a similar bill length? Explain why.1.List the advantages and disadvantages of using relative frequencies in place of frequencies, in constructing histograms and frequency polygons ? 2.consider a research from any feild and classify the variables as descrete or countinous? 3.Describe a binary odinal variable from any area of research