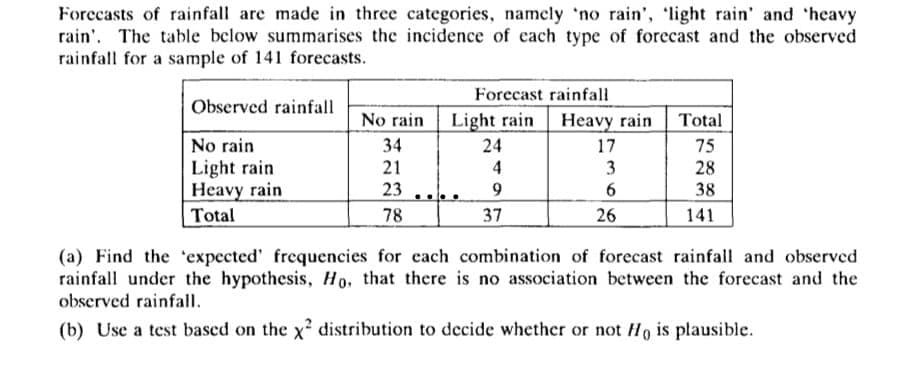
Forecasts of rainfall are made in three categories, namely 'no rain', 'light rain' and 'heavy rain'. The table below summarises the incidence of each type of forecast and the observed rainfall for a sample of 141 forecasts. Forecast rainfall Observed rainfall No rain Light rain Heavy rain Total No rain 34 24 17 75 Light rain. 21 4 3 28 23 9 6 38 Heavy rain Total 78 37 26 141 (a) Find the expected' frequencies for each combination of forecast rainfall and observed rainfall under the hypothesis, Ho, that there is no association between the forecast and the observed rainfall. (b) Use a test based on the x² distribution to decide whether or not Ho is plausible.
Forecasts of rainfall are made in three categories, namely 'no rain', 'light rain' and 'heavy rain'. The table below summarises the incidence of each type of forecast and the observed rainfall for a sample of 141 forecasts. Forecast rainfall Observed rainfall No rain Light rain Heavy rain Total No rain 34 24 17 75 Light rain. 21 4 3 28 23 9 6 38 Heavy rain Total 78 37 26 141 (a) Find the expected' frequencies for each combination of forecast rainfall and observed rainfall under the hypothesis, Ho, that there is no association between the forecast and the observed rainfall. (b) Use a test based on the x² distribution to decide whether or not Ho is plausible.

Algebra & Trigonometry with Analytic Geometry
13th Edition
ISBN:9781133382119
Author:Swokowski
Publisher:Swokowski
Chapter10: Sequences, Series, And Probability
Section10.8: Probability
Problem 19E

Related questions
Question
Transcribed Image Text:Forecasts of rainfall are made in three categories, namely 'no rain', 'light rain' and 'heavy
rain. The table below summarises the incidence of each type of forecast and the observed
rainfall for a sample of 141 forecasts.
Forecast rainfall
Observed rainfall
No rain
Light rain
Heavy rain
Total
No rain
34
24
17
75
21
4
3
28
Light rain
Heavy rain.
23
9
6
38
Total
78
37
26
141
(a) Find the expected' frequencies for each combination of forecast rainfall and observed
rainfall under the hypothesis, Ho, that there is no association between the forecast and the
observed rainfall.
(b) Use a test based on the x² distribution to decide whether or not Ho is plausible.
Expert Solution
This question has been solved!
Explore an expertly crafted, step-by-step solution for a thorough understanding of key concepts.

Step by step
Solved in 2 steps with 2 images

Recommended textbooks for you
Algebra & Trigonometry with Analytic Geometry
Algebra
ISBN:
9781133382119
Author:
Swokowski
Publisher:
Cengage
Algebra & Trigonometry with Analytic Geometry
Algebra
ISBN:
9781133382119
Author:
Swokowski
Publisher:
Cengage