
MATLAB: An Introduction with Applications
6th Edition
ISBN: 9781119256830
Author: Amos Gilat
Publisher: John Wiley & Sons Inc
expand_more
expand_more
format_list_bulleted
Question

Transcribed Image Text:something other than 14 minutes? Use a =0.01.
C 5ん
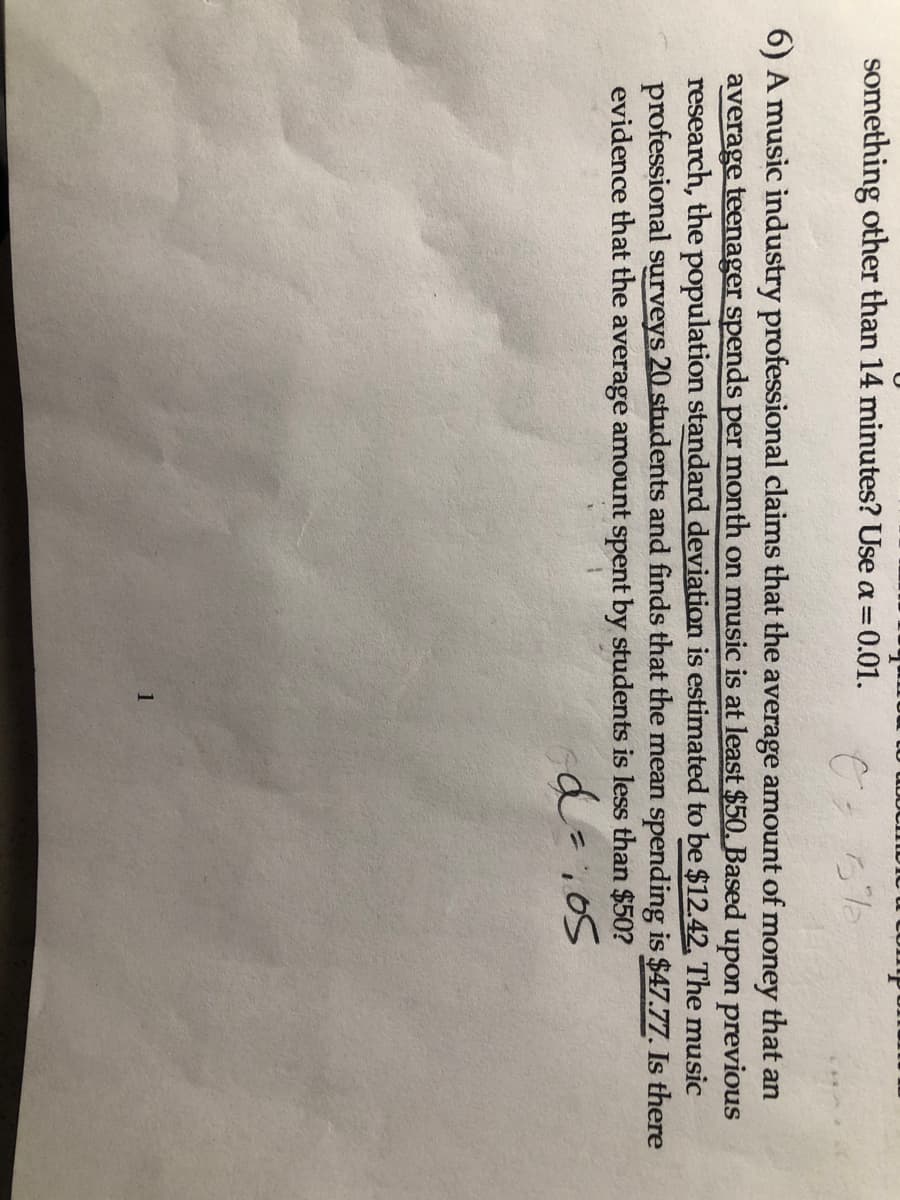
6) A music industry professional claims that the average amount of money that an
average teenager spends per month on music is at least $50. Based upon previous
research, the population standard deviation is estimated to be $12.42, The music
professional surveys 20 students and finds that the mean spending is $47.77. Is there
evidence that the average amount spent by students is less than $50?
Expert Solution

arrow_forward
Step 1
Given that
Hypothesized Population Mean = | |
Population Standard Deviation = | |
Sample Size = | |
Sample Mean = | |
Significance Level |
Trending nowThis is a popular solution!
Step by stepSolved in 2 steps

Knowledge Booster
Similar questions
- A study by the National Center for Health Statistics suggested that women between the ages 20 and 29 in the US have a mean BMI of 26.8 with a standard deviation of 7.4. A BMI of 30 or greater is considered as being obese. What proportion of women in this age range are obese?arrow_forwardAccording to the U.S. Census, the average adult woman is the United States is 65 inches tall and the standard deviation is 3 inches. If Zsike is 67 inches tall, what is her z-score?arrow_forwardThe average McDonald's restaurant generates $3.6 million in sales each year with a standard deviation of 0.9. Trent wants to know if the average sales generated by McDonald's restaurants in Kentucky is different than the worldwide average. He surveys 27 restaurants in Kentucky and finds the following data (in millions of dollars): 4.1, 2.8, 4.4, 4.5, 5.3, 5, 3.7, 2.9, 3.8, 4.8, 3.6, 2.3, 3.7, 2.9, 2.9, 4, 1.1, 5.2, 2.9, 5, 4, 4, 5.9, 3.2, 2.2, 4.3, 3.8 Perform a hypothesis test using a 3% level of significance. Step 1: State the null and alternative hypotheses. Ho: [? v] ? v На: ? ? v (So we will be performing a Select an answer test.) Step 2: Assuming the null hypothesis is true, determine the features of the distribution of point estimates using the Central Limit Theorem. By the Central Limit Theorem, we know that the point estimates are Select an answer v with distribution mean and distribution standard deviation Step 3: Find the p-value of the point estimate. P( ? v ? v = P( ? ♥ ?…arrow_forward
- The average McDonald's restaurant generates $2.4 million in sales each year with a standard deviation of 0.7. Carissa wants to know if the average sales generated by McDonald's restaurants in New Mexico is different than the worldwide average. She surveys 18 restaurants in New Mexico and finds the following data (in millions of dollars): 2.1, 2, 2.9, 1.7, 1.8, 2.3, 2.1, 2.1, 3.3, 1.4, 1.6, 1.4, 1.4, 2.3, 2.6, 2.7, 2.7, 1.7 Perform a hypothesis test using a 8% level of significance. Step 1: State the null and alternative hypotheses. Ho: pv 2.4 Ha: Ev 2.4 (So we will be performing a two-tailed test.) Step 2: Assuming the null hypothesis is true, determine the features of the distribution of point estimates using the Central Limit Theorem. By the Central Limit Theorem, we know that the point estimates are normally distributed v with and distribution standard deviation distribution mean Step 3: Find the p-value of the point estimate. P(zv [ p-value = Step 4: Make a Conclusion About the…arrow_forwardThe U.S. Center for Disease Control reports that in year 1900, the mean life expectancy is 47.6 years for whites and 33 years for nonwhites. (Click here for reference data) Suppose a survey of randomly selected death records for white and nonwhite people born in 1900 from a certain county is conducted. Of the 110 whites surveyed, the mean life span was 48.2 years with a standard deviation of 11.2 years and of the 95 nonwhites, the mean life span was 39.3 years with a standard deviation of 16 years. Conduct a hypothesis test at the 0.05 level of significance to determine whether there was no difference in mean life spans in the county for whites and nonwhites in year 1900. Preliminary: Is it safe to assume thatnw≤5% of all white people born in 1900 andnnw≤5% of all nonwhite people born in 1900? No Yes Is nw≥30 and nnw≥30 ? No Yes Test the claim: Determine the null and alternative hypotheses. H0: μw μnw Ha: μw μnw Determine the test statistic. Round to four…arrow_forwardEspañol Valley College and Elm College are two local colleges. For each college, the distribution of the ages of faculty members is clearly bell-shaped. The ages of faculty members at Valley College have a population mean of 51 years and a standard deviation of 6.3 years. The ages of faculty members at Elm College have a population mean of 56 years and a standard deviation of 4.2 years. Maria is 67 years old and a faculty member at Valley College. Salma is 40 years old and a faculty member at Elm College. (a) Find the z-scores of Maria's age as a faculty member at Valley College and Salma's age as a faculty member at Elm College. Round your answers to two decimal places. z-score of Maria's age: z-score of Salma's age: (b) Relative to her population, who is the older faculty member? Choose the best answer based on the z-scores of the two ages. O Maria O Salma O It is unclear who is the older faculty member relative to her population Explanation 2022 Mc X Terms of Use | Privacy Center |…arrow_forward
- A study states that for a particular area, the average income per family is $34,569 and the standard deviation is $8256. What percentage of families in that area earn below $25,000?arrow_forward1. According to one study, the average hours of sleep on a weeknight for men was 6.9 hours with a standard deviation of 1.5 hours. a. Find the proportion of men who sleep for more than 8 hours per night. b. Find the proportion of men who sleep for less than 6 hours per night. c. Find the proportion of men who sleep between 6-8 hours per night. d. Find the number of hours that represents the 90th percentile.arrow_forwardThe distribution of heights of adult American men is approximately normal with a mean of 69 inches and a standard deviation of 2.5 inches. a. What percent of these men are at least 71.5 inches tall? b. What percent of these men are between 64 and 74 inches tall?arrow_forward
- Last year, the revenue for financial services companies had a mean of 7070 million dollars with a standard deviation of 1818 million. Find the percentage of companies with revenue between 5050 million and 9090 million dollars. Assume that the distribution is normal. Round your answer to the nearest hundredth.arrow_forwardThe average McDonald's restaurant generates $3.3 million in sales each year with a standard deviation of 0.8. Skyler wants to know if the average sales generated by McDonald's restaurants in North Carolina is different than the worldwide average. He surveys 25 restaurants in North Carolina and finds the following data (in millions of dollars): 2.3, 0.9, 2.2, 2.8, 3.1, 3.1, 2.3, 2.6, 2.7, 2.7, 3.1, 3.9, 4.1, 4, 4.5, 1.8, 4.3, 2.7, 3.9, 3.5, 3.2, 1.7, 3.5, 2.9, 2.1 Perform a hypothesis test using a 4% level of significance. Step 1: State the null and alternative hypotheses. Но: ? ? v Ha: ? v (So we will be performing a Select an answer v test.) Step 2: Assuming the null hypothesis is true, determine the features of the distribution of point estimates using the Central Limit Theorem. By the Central Limit Theorem, we know that the point estimates are Select an answer with distribution mean and distribution standard deviation Step 3: Find the p-value of the point estimate. P( ? v ? v P(? v…arrow_forwardThe average McDonald's restaurant generates $2.6 million in sales each year with a standard deviation of 1. Tatiana wants to know if the average sales generated by McDonald's restaurants in Alaska is different than the worldwide average. She surveys 25 restaurants in Alaska and finds the following data (in millions of dollars):3.2, 1.8, 0.9, 3.2, 3.6, 1.7, 4.2, 2, 3.1, 3.9, 3, 2.9, 2.5, 3.5, 3, 3, 2.4, 5, 3.8, 0.9, 2.2, 2.4, 2.6, 2.8, 3.3Perform a hypothesis test using a 10% level of significance. Find the pp-value of the point estimate. P(p( <or > )= P(z<)=P( ? )=)=? p value =?pp-value==arrow_forward
arrow_back_ios
SEE MORE QUESTIONS
arrow_forward_ios
Recommended textbooks for you
- MATLAB: An Introduction with ApplicationsStatisticsISBN:9781119256830Author:Amos GilatPublisher:John Wiley & Sons IncProbability and Statistics for Engineering and th...StatisticsISBN:9781305251809Author:Jay L. DevorePublisher:Cengage LearningStatistics for The Behavioral Sciences (MindTap C...StatisticsISBN:9781305504912Author:Frederick J Gravetter, Larry B. WallnauPublisher:Cengage Learning
- Elementary Statistics: Picturing the World (7th E...StatisticsISBN:9780134683416Author:Ron Larson, Betsy FarberPublisher:PEARSONThe Basic Practice of StatisticsStatisticsISBN:9781319042578Author:David S. Moore, William I. Notz, Michael A. FlignerPublisher:W. H. FreemanIntroduction to the Practice of StatisticsStatisticsISBN:9781319013387Author:David S. Moore, George P. McCabe, Bruce A. CraigPublisher:W. H. Freeman

MATLAB: An Introduction with Applications
Statistics
ISBN:9781119256830
Author:Amos Gilat
Publisher:John Wiley & Sons Inc

Probability and Statistics for Engineering and th...
Statistics
ISBN:9781305251809
Author:Jay L. Devore
Publisher:Cengage Learning

Statistics for The Behavioral Sciences (MindTap C...
Statistics
ISBN:9781305504912
Author:Frederick J Gravetter, Larry B. Wallnau
Publisher:Cengage Learning

Elementary Statistics: Picturing the World (7th E...
Statistics
ISBN:9780134683416
Author:Ron Larson, Betsy Farber
Publisher:PEARSON

The Basic Practice of Statistics
Statistics
ISBN:9781319042578
Author:David S. Moore, William I. Notz, Michael A. Fligner
Publisher:W. H. Freeman

Introduction to the Practice of Statistics
Statistics
ISBN:9781319013387
Author:David S. Moore, George P. McCabe, Bruce A. Craig
Publisher:W. H. Freeman