6. A student scores 56 on a geography test and 285 on a mathematics test. The geography test has a mean of 80 and a standard deviation of 20. The mathematics test has a mean of 300 and a standard deviation of 10. Which score was lower with relative to its respective standard deviation? Explain your answer using the normal curve below. 99.9% 99.7% 95. 5% 68%
6. A student scores 56 on a geography test and 285 on a mathematics test. The geography test has a mean of 80 and a standard deviation of 20. The mathematics test has a mean of 300 and a standard deviation of 10. Which score was lower with relative to its respective standard deviation? Explain your answer using the normal curve below. 99.9% 99.7% 95. 5% 68%

Glencoe Algebra 1, Student Edition, 9780079039897, 0079039898, 2018
18th Edition
ISBN:9780079039897
Author:Carter
Publisher:Carter
Chapter10: Statistics
Section10.4: Distributions Of Data
Problem 19PFA

Related questions
Question
helppp
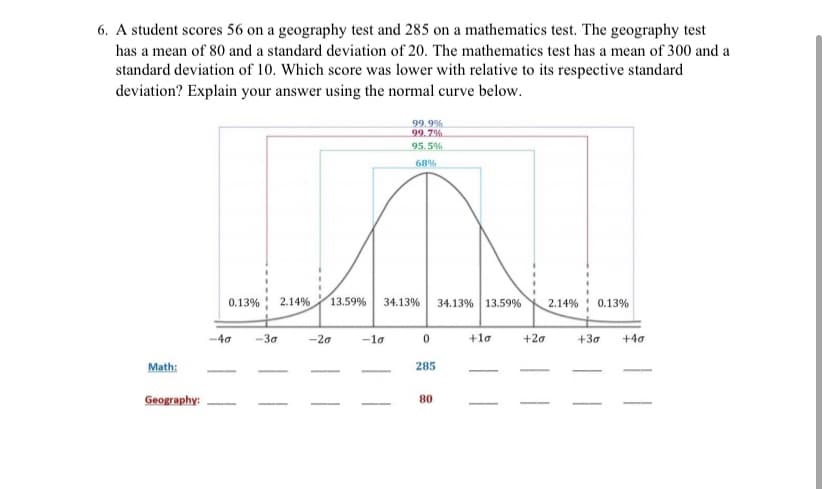
Transcribed Image Text:6. A student scores 56 on a geography test and 285 on a mathematics test. The geography test
has a mean of 80 and a standard deviation of 20. The mathematics test has a mean of 300 and a
standard deviation of 10. Which score was lower with relative to its respective standard
deviation? Explain your answer using the normal curve below.
99.9%
99.7%
95. 5%
68%
0.13%
2.14%
13.59%
34.13%
34.13% 13.59%
2.14% ! 0.13%
-40
-30
-20
-1o
+la
+20
+30
+40
Math:
285
Geography:
80
Expert Solution
This question has been solved!
Explore an expertly crafted, step-by-step solution for a thorough understanding of key concepts.

This is a popular solution!

Trending now
This is a popular solution!

Step by step
Solved in 2 steps with 8 images

Recommended textbooks for you
Glencoe Algebra 1, Student Edition, 9780079039897…
Algebra
ISBN:
9780079039897
Author:
Carter
Publisher:
McGraw Hill
Glencoe Algebra 1, Student Edition, 9780079039897…
Algebra
ISBN:
9780079039897
Author:
Carter
Publisher:
McGraw Hill