6. Equilibrium prices and quantities are determined by demand D₁ = 200-2p1 and supply S₁ = 2p1-40 in the market for Good 1 and by D₂ = 240-2p2 and supply S₂ = 2p2-P1-20 in the market for Good 2. a. Provide a diagram showing the equilibrium price and quantity in the market for Good 1 and a second diagram showing the equilibrium price and quantity in the market for Good 2. b. Next month the government will introduce a t = 40 per unit tax in the market for Good 1 (not Good 2). Update your diagrams to show and quantify how prices and quantities will be affected in both markets. C. Illustrate (do not calculate) why the price of Good 2 would increase by more if the demand curve in Market 1 was more elastic.
6. Equilibrium prices and quantities are determined by demand D₁ = 200-2p1 and supply S₁ = 2p1-40 in the market for Good 1 and by D₂ = 240-2p2 and supply S₂ = 2p2-P1-20 in the market for Good 2. a. Provide a diagram showing the equilibrium price and quantity in the market for Good 1 and a second diagram showing the equilibrium price and quantity in the market for Good 2. b. Next month the government will introduce a t = 40 per unit tax in the market for Good 1 (not Good 2). Update your diagrams to show and quantify how prices and quantities will be affected in both markets. C. Illustrate (do not calculate) why the price of Good 2 would increase by more if the demand curve in Market 1 was more elastic.

Brief Principles of Macroeconomics (MindTap Course List)
8th Edition
ISBN:9781337091985
Author:N. Gregory Mankiw
Publisher:N. Gregory Mankiw
Chapter4: The Market Forces Of Supply And Demand
Section: Chapter Questions
Problem 11PA

Related questions
Question
Explain Step by Step
Thanks!
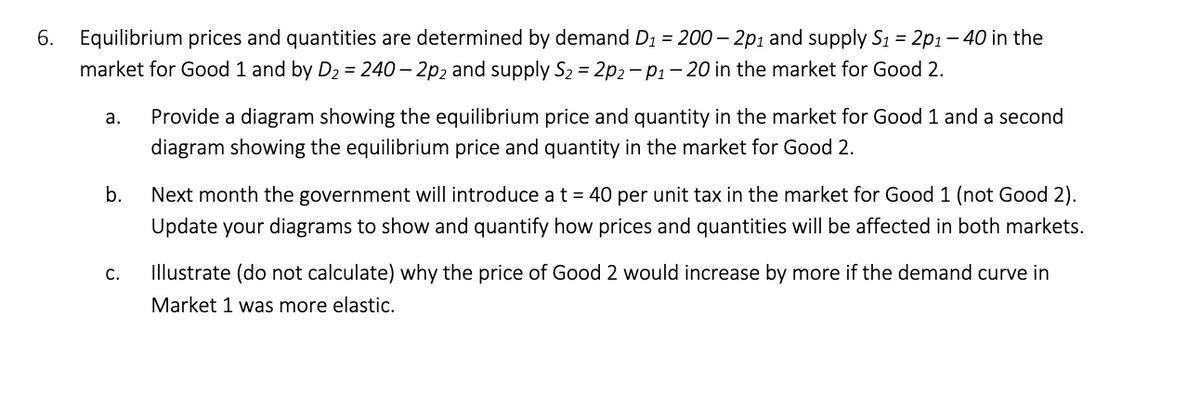
Transcribed Image Text:6. Equilibrium prices and quantities are determined by demand D₁ = 200-2p1 and supply S₁ = 2p1-40 in the
market for Good 1 and by D₂ = 240-2p2 and supply S₂ = 2p2-P1-20 in the market for Good 2.
a.
Provide a diagram showing the equilibrium price and quantity in the market for Good 1 and a second
diagram showing the equilibrium price and quantity in the market for Good 2.
b.
Next month the government will introduce a t = 40 per unit tax in the market for Good 1 (not Good 2).
Update your diagrams to show and quantify how prices and quantities will be affected in both markets.
C.
Illustrate (do not calculate) why the price of Good 2 would increase by more if the demand curve in
Market 1 was more elastic.
Expert Solution
This question has been solved!
Explore an expertly crafted, step-by-step solution for a thorough understanding of key concepts.

Step by step
Solved in 2 steps with 3 images

Knowledge Booster


Learn more about
Need a deep-dive on the concept behind this application? Look no further. Learn more about this topic, economics and related others by exploring similar questions and additional content below.Recommended textbooks for you
Brief Principles of Macroeconomics (MindTap Cours…
Economics
ISBN:
9781337091985
Author:
N. Gregory Mankiw
Publisher:
Cengage Learning

Principles of Economics, 7th Edition (MindTap Cou…
Economics
ISBN:
9781285165875
Author:
N. Gregory Mankiw
Publisher:
Cengage Learning

Essentials of Economics (MindTap Course List)
Economics
ISBN:
9781337091992
Author:
N. Gregory Mankiw
Publisher:
Cengage Learning
Brief Principles of Macroeconomics (MindTap Cours…
Economics
ISBN:
9781337091985
Author:
N. Gregory Mankiw
Publisher:
Cengage Learning
Principles of Economics, 7th Edition (MindTap Cou…
Economics
ISBN:
9781285165875
Author:
N. Gregory Mankiw
Publisher:
Cengage Learning
Essentials of Economics (MindTap Course List)
Economics
ISBN:
9781337091992
Author:
N. Gregory Mankiw
Publisher:
Cengage Learning

Principles of Microeconomics (MindTap Course List)
Economics
ISBN:
9781305971493
Author:
N. Gregory Mankiw
Publisher:
Cengage Learning

Principles of Economics (MindTap Course List)
Economics
ISBN:
9781305585126
Author:
N. Gregory Mankiw
Publisher:
Cengage Learning
