6. For one of the trials, calculate the change in position during each 5 second interval. (Average of Experiment #1) Time (t) in seconds Position (x) in. centimeters Change in Position (cm) (s) Interval (sec) (t) 10 15 20 25 30 Questions and Conclusions: 1. Referring to the data above, does the position change by the same amount in equal intervals? What does this tell you about the speed? 2. Plot the average of each experiment on graph paper on the same axis. Use different colors or symbols to distinguish between the two lines.
6. For one of the trials, calculate the change in position during each 5 second interval. (Average of Experiment #1) Time (t) in seconds Position (x) in. centimeters Change in Position (cm) (s) Interval (sec) (t) 10 15 20 25 30 Questions and Conclusions: 1. Referring to the data above, does the position change by the same amount in equal intervals? What does this tell you about the speed? 2. Plot the average of each experiment on graph paper on the same axis. Use different colors or symbols to distinguish between the two lines.

Chapter12: Relativity, Particle Physics, And Cosmology
Section: Chapter Questions
Problem 4Q

Related questions
Question
please help me question number 6 and the two questions on the bottom after it
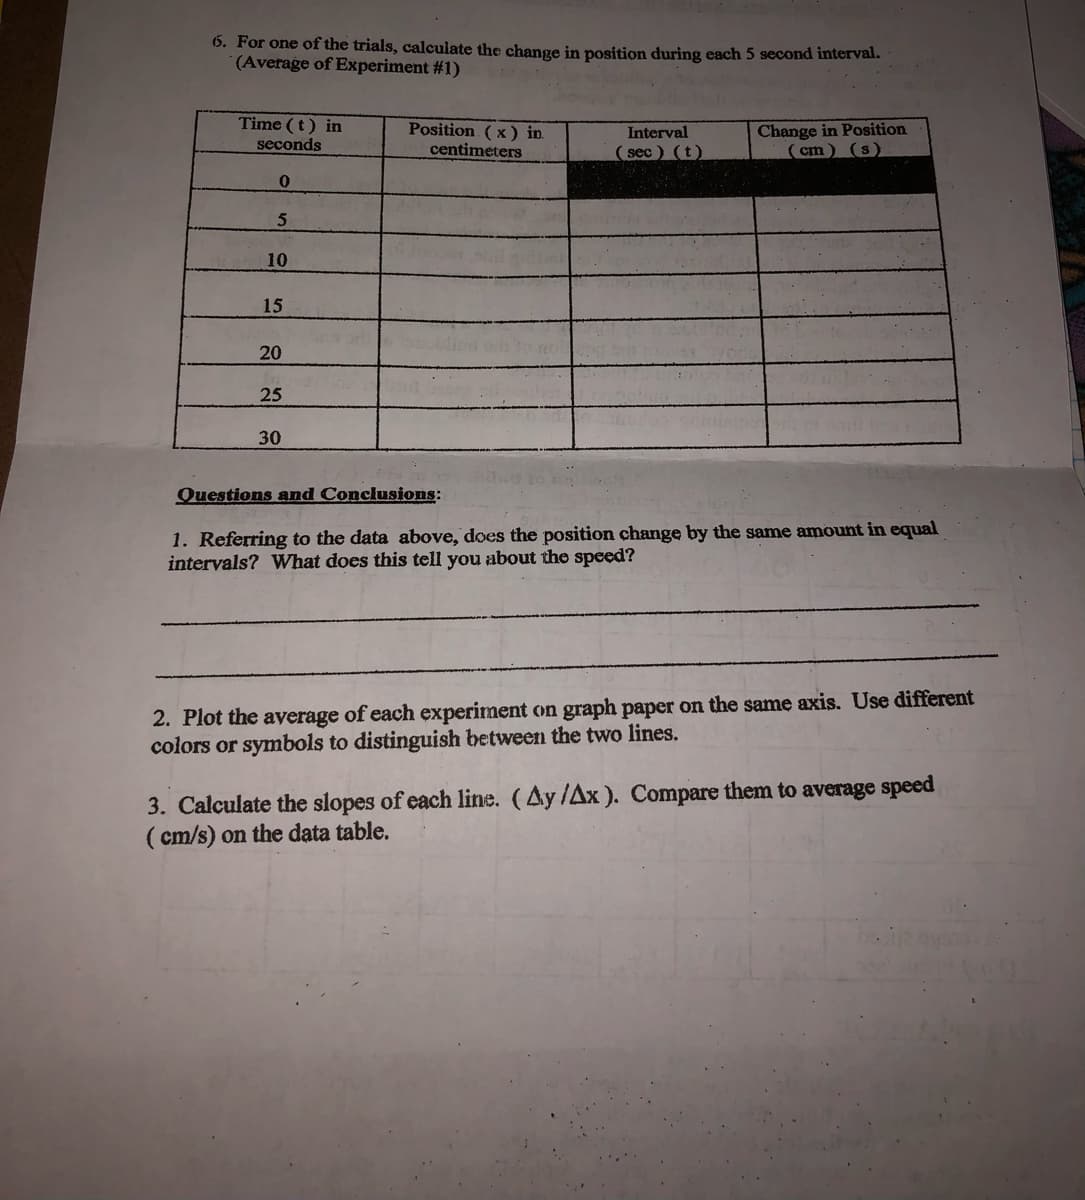
Transcribed Image Text:6. For one of the trials, calculate the change in position during each 5 second interval.
(Average of Experiment #1)
Time (t) in
seconds
Position (x) in.
centimeters
Interval
(sec) (t)
Change in Position
( cm) (s)
10
15
20
25
30
Questions and Conclusions:
1. Referring to the data above, does the position change by the same amount in equal
intervals? What does this tell you about the speed?
2. Plot the average of each experiment on graph paper on the same axis. Use different
colors or symbols to distinguish between the two lines.
3. Calculate the slopes of each line. (Ay /Ax ). Compare them to average speed
( cm/s) on the data table.
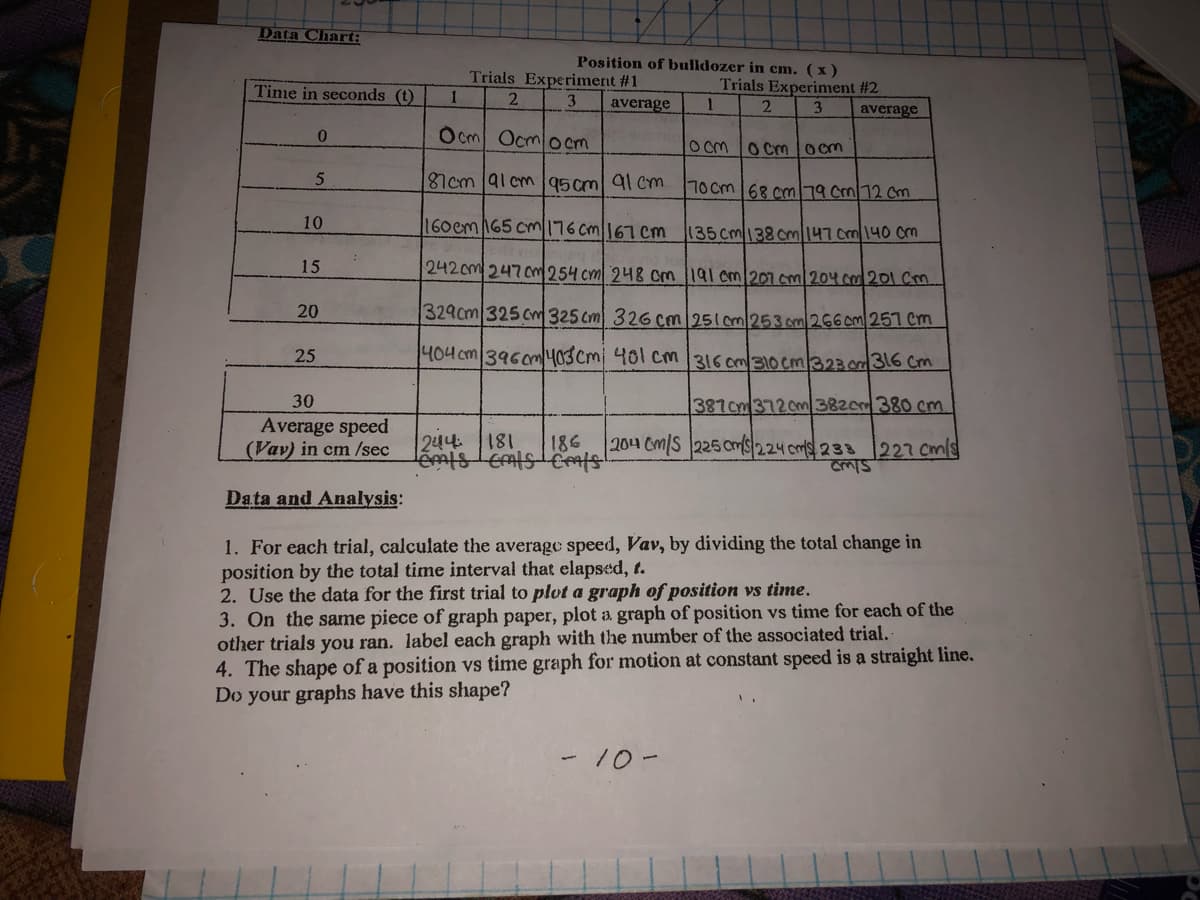
Transcribed Image Text:Data Chart:
Position of bulldozer in cm. (x)
Time in seconds (t)
Trials Experimerit #1
1
Trials Experiment #2
2
3
average
3.
average
O cm Ocmo cm
O cMO Cm ocm
5
187cm 91 cm 95 cm 91 cm.
70 cm 68 cm 19 Cm/12 Cm
10
160em165 cm176 cm167cm
135 cm138cm147 cm140 cm
15
2420m 2470m 254 cm 248 cm 191 cm207.cm/204col 201 Cm
20
329cm 325 cm 325 cm 326 cm 251cm253 om/2660m 251 Cm
25
404 cm 3960m403cm 401 cm 316 cm/310 cm/323.00316 Cm
30
387cm3720m3820m 380 cm
Average speed
(Vav) in cm /sec
244 181
2014 Cm/S 225 cm/224 cms 233 227 cmls
186
Data and Analysis:
1. For each trial, calculate the average speed, Vav, by dividing the total change in
position by the total time interval that elapsed, t.
2. Use the data for the first trial to plot a graph of position vs time.
3. On the same piece of graph paper, plot a graph of position vs time for each of the
other trials you ran. label each graph with the number of the associated trial.-
4. The shape of a position vs time graph for motion at constant speed is a straight line.
Do your graphs have this shape?
-10-
1.
Expert Solution
This question has been solved!
Explore an expertly crafted, step-by-step solution for a thorough understanding of key concepts.

Step by step
Solved in 2 steps with 1 images

Knowledge Booster


Learn more about
Need a deep-dive on the concept behind this application? Look no further. Learn more about this topic, physics and related others by exploring similar questions and additional content below.Recommended textbooks for you

College Physics
Physics
ISBN:
9781938168000
Author:
Paul Peter Urone, Roger Hinrichs
Publisher:
OpenStax College

College Physics
Physics
ISBN:
9781305952300
Author:
Raymond A. Serway, Chris Vuille
Publisher:
Cengage Learning
College Physics
Physics
ISBN:
9781938168000
Author:
Paul Peter Urone, Roger Hinrichs
Publisher:
OpenStax College
College Physics
Physics
ISBN:
9781305952300
Author:
Raymond A. Serway, Chris Vuille
Publisher:
Cengage Learning

College Physics
Physics
ISBN:
9781285737027
Author:
Raymond A. Serway, Chris Vuille
Publisher:
Cengage Learning

Foundations of Astronomy (MindTap Course List)
Physics
ISBN:
9781337399920
Author:
Michael A. Seeds, Dana Backman
Publisher:
Cengage Learning

Glencoe Physics: Principles and Problems, Student…
Physics
ISBN:
9780078807213
Author:
Paul W. Zitzewitz
Publisher:
Glencoe/McGraw-Hill