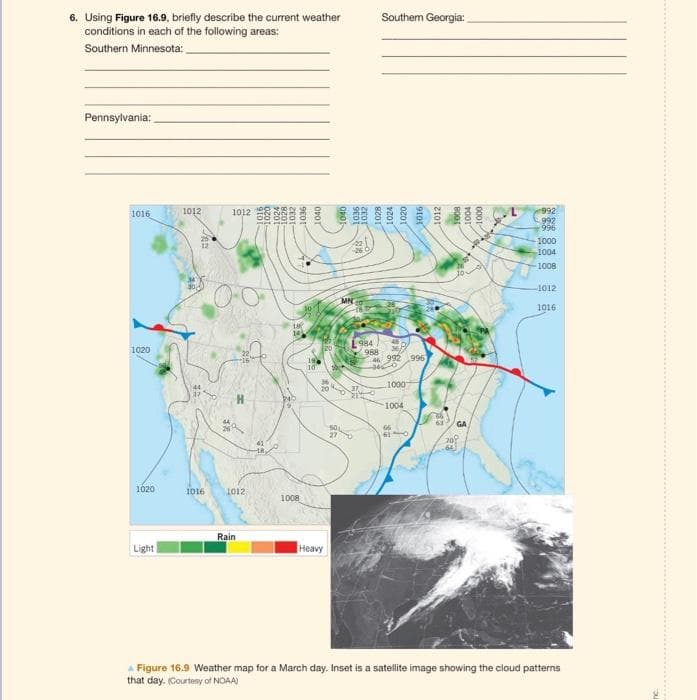
6. Using Figure 16.9, briefly describe the current weather conditions in each of the following areas: Southern Minnesota: Pennsylvania: Southern Georgia:
6. Using Figure 16.9, briefly describe the current weather conditions in each of the following areas: Southern Minnesota: Pennsylvania: Southern Georgia:

Applications and Investigations in Earth Science (9th Edition)
9th Edition
ISBN:9780134746241
Author:Edward J. Tarbuck, Frederick K. Lutgens, Dennis G. Tasa
Publisher:Edward J. Tarbuck, Frederick K. Lutgens, Dennis G. Tasa
Chapter1: The Study Of Minerals
Section: Chapter Questions
Problem 1LR

Related questions
Question
Transcribed Image Text:6. Using Figure 16.9, briefly describe the current weather
conditions in each of the following areas:
Southern Minnesota:
Pennsylvania:
1016
1020
1020
Light
1012
1016
1012
H
1012
Rain
1008
19
10
20
20
Heavy
MN
VO
ZEO
8201
L 984
Southern Georgia:
988
1024
1020
46 992 996
-346-0
1000
-1004
9101
66
6140
1012
Mode
992
992
996
1000
1004
1008
-1012
1016
A Figure 16.9 Weather map for a March day. Inset is a satellite image showing the cloud patterns
that day. (Courtesy of NOAA)
Transcribed Image Text:Wind speed. (21 to
25 miles per hour.)
Direction of wind.
(From the north
west.)
Temperature in
degrees Fahrenheit
Total amount of
clouds. (Sky com
pletely covered.)
Visibility. (3/4
mile.)
Present weather.
(Continuous slight
snow in flakes)
Dewpoint in de
grees Fahrenheit.
Cloud type. (Low
fractostratus and/or
fractocumulus.)
Height of cloud
base (300 to 599
feet.)
O
L
U
UL
W!!!
Wind Speed
Miles
per hour
Calm
1-2
3-8
9-14
15-20
21-25
Station Model
SPECIMEN
STATION MODEL
Cloud type
(High cirrus)
-A
67-71
+28
3064
245
Part of sky co-
ered by lowest
cloud. (Seven or
eight tenth.)
Knots
per hour
Calm
1-2
3-7
8-12
13-17
18-22
26:31 23-27
32-37
28-32
33-37
38-43
44-49
50-54
55-60
61-66 53-57
38-42
43-47
48-52
58-62
72-77 63-67
Cloud type. (Mid
die altocumulus
Barometric pres
sure at sea level. Ini
tial 9 or 10 omitted
(1024.7 miliars)
Amount of baro
metric change in
past 3 hours
(-28-+2.8 mb
Barometric tend-
dency in past 3
hours (Rising)
Sign showing
whether pressure is
higher or lower than
3 hours ago.
Time precipitation
began or ended. (Be
gan 3 to 4 hours
ago.)
Weather in past 6
hours (Rain.)
Amount of precip
tation in last 6
hours (45 inch)
Sky Coverage (total amount
O
Six-tehs
Seven-tenths or eight-
tenths
Barometric Tendency
Rising, then falling
Rising, then steady; or
rising the rising more
slowly
2/ Rising steadily, or un
No clouds
Less than one-tenth or
one-tenth
Two-tenths or three-
tenths
Four-tenth
Five-tenths
Front symbols are given below:
0
1
Falling or steady, then
3 rising or rising, then
rising more quickly
5
6
7
Nine-tenths or overcast
with openings
Completely overcast
Sky obscured
12
//
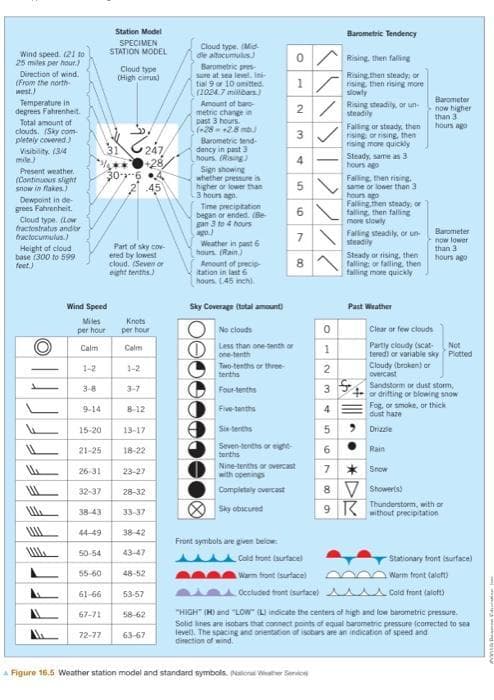
& Figure 16.5 Weather station model and standard symbols. (National Weather Serv
0
1
2
3
4
5
Cold front (surface)
Warm front (surface)
Occluded front (surface) s
Steady, same as 3
hours ago
Falling, then rising.
same or lower than 3
hours ago
Falling, then steady, or
falling, then falling
more slowly
Falling steadily, or un
steadily
Steady or rising, then
falling or falling, then
falling more quickly
Past Weather
●
Barometer
now higher
than 3
hours ago
Barometer
now lower
than 3
hours ago
Clear or few clouds
Partly cloudy (scat-
tered) or variable sky
Cloudy (broken) or
overcast
Rain
* Snow
Sandstorm or dust storm,
or drifting or blowing snow
Fog, or smoke, or thick
dust haze
Drizzle
7
8 V
Shower(s)
9K without precipitation
Not
Plotted
or
-Stationary front (surface)
Warm front (aloft)
Cold front (aloft)
indicate the centers of high and low barometric pressure.
"HIGH" (H) and "LOW"
Solid lines are isobars that connect points of equal barometric pressure (corrected to sea
level. The spacing and orientation of isobars are an indication of speed and
direction of wind
Expert Solution
This question has been solved!
Explore an expertly crafted, step-by-step solution for a thorough understanding of key concepts.

This is a popular solution!

Trending now
This is a popular solution!

Step by step
Solved in 4 steps

Recommended textbooks for you
Applications and Investigations in Earth Science …
Earth Science
ISBN:
9780134746241
Author:
Edward J. Tarbuck, Frederick K. Lutgens, Dennis G. Tasa
Publisher:
PEARSON

Exercises for Weather & Climate (9th Edition)
Earth Science
ISBN:
9780134041360
Author:
Greg Carbone
Publisher:
PEARSON

Environmental Science
Earth Science
ISBN:
9781260153125
Author:
William P Cunningham Prof., Mary Ann Cunningham Professor
Publisher:
McGraw-Hill Education
Applications and Investigations in Earth Science …
Earth Science
ISBN:
9780134746241
Author:
Edward J. Tarbuck, Frederick K. Lutgens, Dennis G. Tasa
Publisher:
PEARSON
Exercises for Weather & Climate (9th Edition)
Earth Science
ISBN:
9780134041360
Author:
Greg Carbone
Publisher:
PEARSON
Environmental Science
Earth Science
ISBN:
9781260153125
Author:
William P Cunningham Prof., Mary Ann Cunningham Professor
Publisher:
McGraw-Hill Education

Earth Science (15th Edition)
Earth Science
ISBN:
9780134543536
Author:
Edward J. Tarbuck, Frederick K. Lutgens, Dennis G. Tasa
Publisher:
PEARSON

Environmental Science (MindTap Course List)
Earth Science
ISBN:
9781337569613
Author:
G. Tyler Miller, Scott Spoolman
Publisher:
Cengage Learning

Physical Geology
Earth Science
ISBN:
9781259916823
Author:
Plummer, Charles C., CARLSON, Diane H., Hammersley, Lisa
Publisher:
Mcgraw-hill Education,