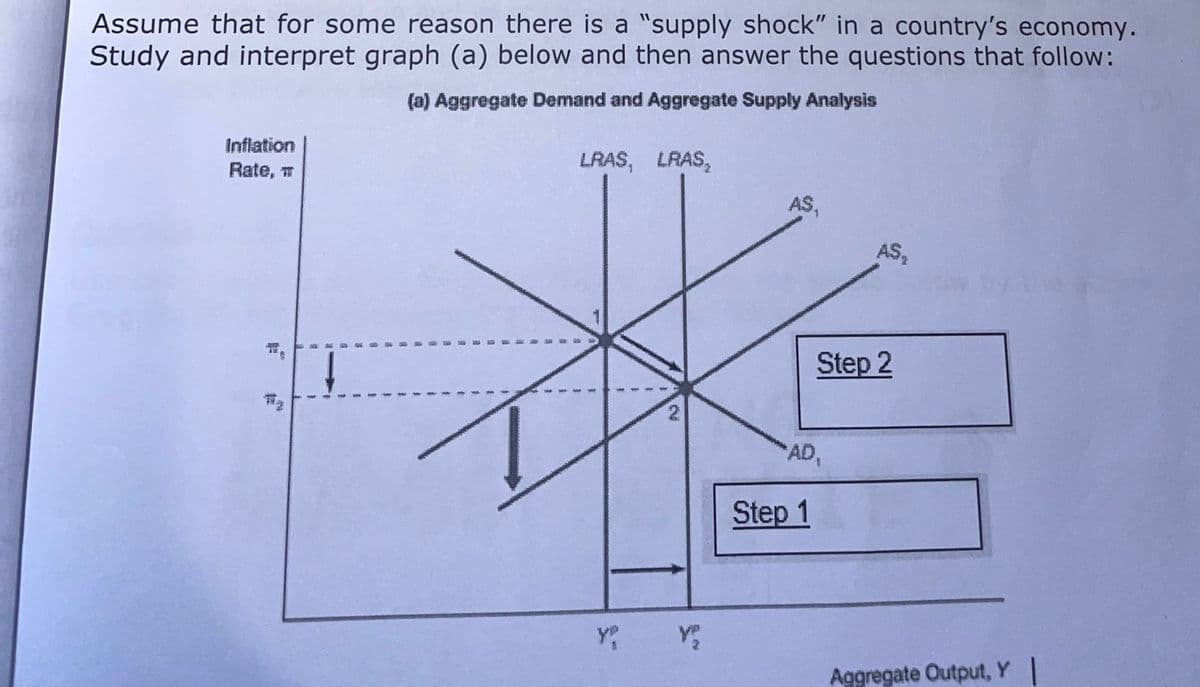
6.1. What is an AD-AS model and what does such a model as per the given diagram essentially focus on? 6.2. Discuss the diagram in detail by first explaining what leads to step Step 1 (representing a shift in curves on the diagram) and indicating what occurs to cause shifts in some of the curves. Then discuss Step 2 (which represents other macroeconomic changes) and indicate what happens to other variables when there are shifts in some of the curves as per Step 1. 6.3. What, in general, do the points of intersection between the AS and AS2 curves and the AD curve show?


6.1.
What is an AD-AS model and what does such a model as per the given
diagram essentially focus on?
6.2.
Discuss the diagram in detail by first explaining what leads to step Step 1
(representing a shift in curves on the diagram) and indicating what occurs
to cause shifts in some of the curves. Then discuss Step 2 (which
represents other
other variables when there are shifts in some of the curves as per Step 1.
6.3.
What, in general, do the points of intersection between the AS and AS2
curves and the AD curve show?
6.4.
When the LAS curve moves to the right to LRAS2, what exactly do the
points of intersection between the AS and AS curves and the AD1 curve,
indicated as point 1 and point 2, reflect on the diagram?


Trending now
This is a popular solution!

Step by step
Solved in 2 steps


