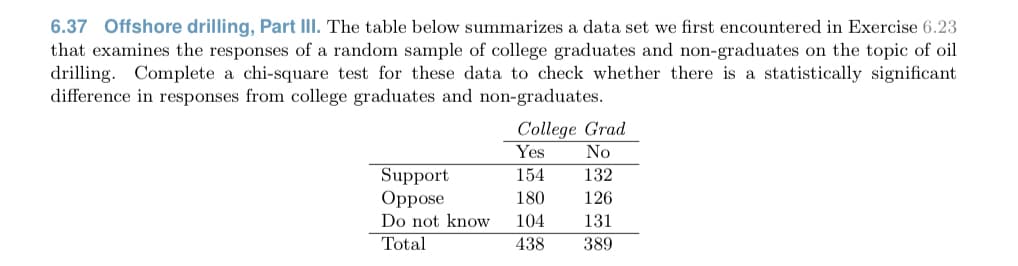
6.37 Offshore drilling, Part III. The table below summarizes a data set we first encountered in Exercise 6.23 that examines the responses of a random sample of college graduates and non-graduates on the topic of oil drilling. Complete a chi-square test for these data to check whether there is a statistically significant difference in responses from college graduates and non-graduates. College Grad Yes No 154 Support Oppose Do not know Total 132 180 126 104 131 438 389
Q: What statistical tool should be used when you want to compare 4 refrigerators to know if there is a…
A: Given Information: Consider the information in which you want to compare 4 refrigerators.
Q: In a random sample of sixteen different industries the percentage employment x in STEM (science…
A: We have given that, SSxx = 1303.9, SSyy = 2660.2 and SSxy = 1503.0 Σ X = 150.1, Σ Y = 915 , n = 16…
Q: The Joint Distribution of the Minimum and Maximum EX2: Pyoot Fxa.X(n) (x, y) = P(X(1) < x, X(n) y) =…
A: We need to prove the joint distribution of the Minimum X(1) and Maximum X(n) , such that:
Q: Only 20% of registered voters voted in the last election. Will voter participation change for the…
A: Given data n = 317 X = 54 Alpha = 0.05 Using z test for population proportion
Q: 12. An index number of 400 means A. goods cost 3 times as much as the base year. B. goods cost 4…
A:
Q: Hypotheses: H0:p=0.5H0:p=0.5 vs Ha:p≠0.5Ha:p≠0.5; Sample data: p^=2840=0.70p^=2840=0.70 with n=40
A: Solution-: Given: n=40,x=28,P0=0.5 Hypothesis: H0:p=P0=0.5 Vs H1:p≠0.5 (Two…
Q: A blogger claims that U.S. adults drink an average of 40 ounces (that's five 8-ounce glasses) of…
A: From the provided information, The claim is that US adults drink an average of 40 ounces of water…
Q: A. The distribution of results from a cholesterol test has a mean of 180 and a standard deviation of…
A: For any known and unknown distribution with a mean and standard deviation is given. If the sample…
Q: 5. Which of the following is the correct sample space for the sum of two 6 sided dice? (a) {1, 2, 3,…
A: We need to find the sample space of the sum of two 6 sided dice.
Q: Situation 2: I went to the grocery store and I noticed that there are five different kinds of brown…
A:
Q: I am trying to do a Pooled standard deviation = (n1-1)s1²+(n2-1)s2²/(n1=n2-2), however, I am having…
A:
Q: A multiple regression analysis produced the following tables. Summary Output…
A: There are 2 independent variables and 1 dependent variable. We have to test the model by using given…
Q: For the data shown, answer the questions. Round to 4 decimal places wherep 2.6 23.9 13.3 14.6 17.7…
A: We have given that, The data set are, 2.6, 23.9, 13.3, 14.6, 17.7, 9.3, 29.1, 9.8, 28.1 Then, We…
Q: It is claimed that 20% of dog owners have at least two dogs. A researcher believes that more than…
A: We have to identify what is the mistake made in following hypothesis, Ho: p = 0.32 V/S Ha: p…
Q: Question 7 Indicate for each statement whether it is correct or incorrect. Correct Incorrect In a…
A: We have given the statement about multivariate regression model.
Q: O D. Ho: H1 = H2, H,:Hy> H2 Determine the test statistic. t= (Round to two decimal places as
A:
Q: 1. What is the meaning of а. а? b. B? C. type l error? d. type Il error? e. the p-value? f. Ho? g.…
A: α significance level in hypothesis test, or acceptable probability of a Type I error β the…
Q: What is the Discrete Variable Standard Deviation for the following numbers: Sample size is 107 with…
A: Introduction: Binomial Random Variable: A discrete random variable with finite number of…
Q: What is the total value of the test statistic? Express the answer without rounding, since the…
A: The categorical variable is payment method, it has 5 categories. We have to find the value of the…
Q: The average production of peanuts in the Philippines is 3100 pounds per acre. A new plant food has…
A: Here is given that, mean is 3120 and standard deviation is 578. Population mean is 3100 and sample…
Q: ildre
A: Categorical variables in which variable can use one of limited and fixed possible value. Categorical…
Q: 11. There are 8 women and 10 men in the math department. (a) How many ways can a committee of 4…
A: Given that, there are 8 women and 10 men in the math department. We need to find: (a) How many ways…
Q: and unskilled workers in two exceeds the average hourly wage in Ram Nagar, even though in average…
A:
Q: . If the net single premium of a 20-year term insurance policy, issued to (50), with a death benefit…
A: Given Insurance Type : Term insurance policy Duration : 20 years The net single premium :…
Q: orkers in two small communities, together with their sverage hourly wages." Ram Nagar Shyam Nagar…
A:
Q: A recent report claimed that 13% of students typically walk to school. DeAnna thinks that the…
A: The random variable students typically walk to school follows normal distribution. We have to test…
Q: In Orange County, 51% of the adults are males. One adult is randomly selected for a survey involving…
A:
Q: •.• $6.10 A process that is considered to be in control measures an ingredient in ounces. Below are…
A:
Q: In a poll of 1000 randomly selected prospective voters in a local election, 281 voters were in favor…
A: We have given that, Favorable cases (X) = 281 and sample size (n) = 1000 Then, We will find the…
Q: A marketing consultant observes 50 consecutive shoppers at a supermarket, recording how much each…
A: The sample is the any fraction of the population that explains the true population characteristic.…
Q: 1. Given the information below, would you calculate the standard error () or the estimated standard…
A: Since, the exact question number is not specified, we'll be answering the first question. Please re…
Q: Due to stress, many patients who undergo major elective surgery experience an increase in blood…
A: It is needed to find the appropriate statistical test.
Q: 1. Let A and B be two events such that P(A) = 0.4, P(B) = 0.7, P(A U B) = 0.9 a) Find P(A N B). b)…
A: Introduction: Let A and B are the two events. Law of Addition of probability: It is denoted by…
Q: 5. Calculate D. Probability of female respondents and not liking shopping for clothes E.…
A:
Q: A tandom sample of 90 eighth grade students' scores on a national mathematics assessment test has a…
A:
Q: 2. A psychologist estimates the I.Q of 28 students. The values are as follows: 103, 86, 94, 97, 100,…
A:
Q: 3. If you're given a value of a, then what do you do if the p-value < a?
A: If we are given the value of α and p-value
Q: Use the data in the following table, which lists drive-thru order accuracy at popular fast food…
A: Solution: A B C D Total Order Accurate 313 261 234 136 944 Order Not Accurate 32 51 40…
Q: The Ministry of Health is interested in determining whether the average nicotine content of regular,…
A: Given that The excel output of the problem is Given below Hence no alpha is Given taken alpha as…
Q: The probability that a patient recovers from a stomach disease is 0.7. Suppose 20 people are known…
A: Given that, p=0.7, n=20 and X ~ Bin (20 , 0.7) q=1-p q=0.3 by using binomial distribution
Q: curve of second degree to the data given below and estimate parabolic he value for 1999. Fit a
A:
Q: Solve the following problems and answer the following questions, based upon the following context,…
A: It is given that the management had previously anticipated that the Bronze and Silver membership…
Q: The population of dragonflies in Cititon have lengths that are normally distributed with a mean of 7…
A:
Q: 4. A coin is tossed 25 times. Estimate the chance of getting 12 heads and 13 tails.
A: As per company guidelines I solved only First questions.thank you
Q: Use the same data set from problem #1. Test whether or not H:B = 0 using an F-test with a = .05.…
A: Given Information: Consider the given data: x y 4 16 1 5 2 12 3 17 3 13 4 22
Q: The following table gives the expected and observed frequencies of 4096 throws of 12 coins. Compare…
A:
Q: 1. Let A and B be two events such that P(A) = 0.4, P(B) = 0.7, P(A U B) = 0.9 a) Find P(A N B). b)…
A: Solution-: Given: P(A)=0.4, P(B)=0.7, P(A∪B)=0.9 We find, (d) P(AC-B)=?
Q: Construct and interpret a 95% confidence interval for the proportion (p) of employees who are…
A: here given, n = 200 sample mean of no of hour employee spend reading and writing work-related…
Q: You are thinking about opening a restaurant and are searching for a good location. From research you…
A: Given that
Q: The weekly demand of a slow-moving product has the probability mass function shown in the image…
A: Let X be the random variable having probability mass function is, Demand (X) Probability f(x)…
Trending now
This is a popular solution!
Step by step
Solved in 2 steps with 2 images
- Listed below are paired data consisting of waist size in centimeters and Body Mass Index BMI from a random sample of 20 adult men selected from the population. At the a = 0.05 significance level, test the claim that there is positive linear correlation between waist size and Body Mass Indices in adult men, by answering questions a. thru e. below. That is, test the claim: ρ>0 This uses a Null Hypothesis of ρ =0 and an Alternative Hypothesis of ρ>0 WAIST BMI 120.4 33.3 107.8 28.0 120.3 45.4 97.2 28.4 95.1 25.9 112.0 31.1 78.0 20.1 103.5 32.7 89.7 25.8 112.0 36.5 95.0 25.8 115.3 34.5 118.8 37.4 92.6 26.1 75.5 19.3 101.8 29.9 92.5 27.4 100.8 31.4 82.8 21.0 92.9 28.5 a. What is the linear correlation coefficient r = ___________________________ b. What is the P-Value…A Canadian study measuring depression level in teens (as reported in the Journal of Adolescence, vol. 25, 2002) randomly sampled 112 male teens and 101 female teens, and scored them on a common depression scale (higher score representing more depression). The researchers suspected that the mean depression score for male teens is higher than for female teens, and wanted to check whether data would support this hypothesis. If μ1 and μ2 represent the mean depression score for male teens and female teens respectively, which of the following is an appropriate pair of hypotheses in this case? Check all that apply.A researcher obtains t(20) = 2.00 and MD = 9 for a repeated-measures study. If the researcher measures effect size using the percentage of variance accounted for, what value will be obtained for r2?
- A sample of men and women who had passed their driver's test either the first time or the second time were surveyed, with the following results: Results of the driving testGender First time Second timeMen 126 211Women 135 178a) Do these data suggest that there is a relationship between gender and the passing of their driver’s test from which the present sample was drawn? Let alpha=.056.4.10. In a study of factors thought to be responsible for the adverse effects of smoking on human reproduction, cadmium level determinations (nanograms per gram) were made on placenta tissue of a sample of 14 mothers who were smokers and an independent random sample of 18 nonsmoking mothers. The results were as follows: Nonsmokers: 10.0.8.4. 12.8, 25.0, 11.8.9.8. 12.5, 15.4.23.5, 9.4. 25.1, 19.5. 25.5.9.8. 7.5, 11.8, 12.2, 15.0 Smokers: 30.0, 30.1, 15.0, 24.1, 30.5, 17.8, 16.8, 14.8, 13.4, 28.5, 17.5, 14.4, 12.5, 20.4 Does it appear likely that the mean cadmium level is higher among smokers than nonsmokers? Why do you reach this conclusion?1. Solve the given problem using the stepwise method in testing hypotheses. What is the correlation between these two variables: use .05 level of significance (two-tailed). Stress Sense of Humor 4 2 10 8 12 11 5 3 7 8 6 7 2 3 14 13