65 years old or older. Accol value, how many 65 and older Americans actually got the flu vaccine during this time 20 period? on 10 е. Just because the 65 and older category had the greater percentage, does that also 6 mos to 17 yrs mean the 65 and older group has the most people getting vaccinated? Explain.
65 years old or older. Accol value, how many 65 and older Americans actually got the flu vaccine during this time 20 period? on 10 е. Just because the 65 and older category had the greater percentage, does that also 6 mos to 17 yrs mean the 65 and older group has the most people getting vaccinated? Explain.

Linear Algebra: A Modern Introduction
4th Edition
ISBN:9781285463247
Author:David Poole
Publisher:David Poole
Chapter4: Eigenvalues And Eigenvectors
Section4.6: Applications And The Perron-frobenius Theorem
Problem 22EQ

Related questions
Question
Transcribed Image Text:s Activity-Chapter 3
Math 2600
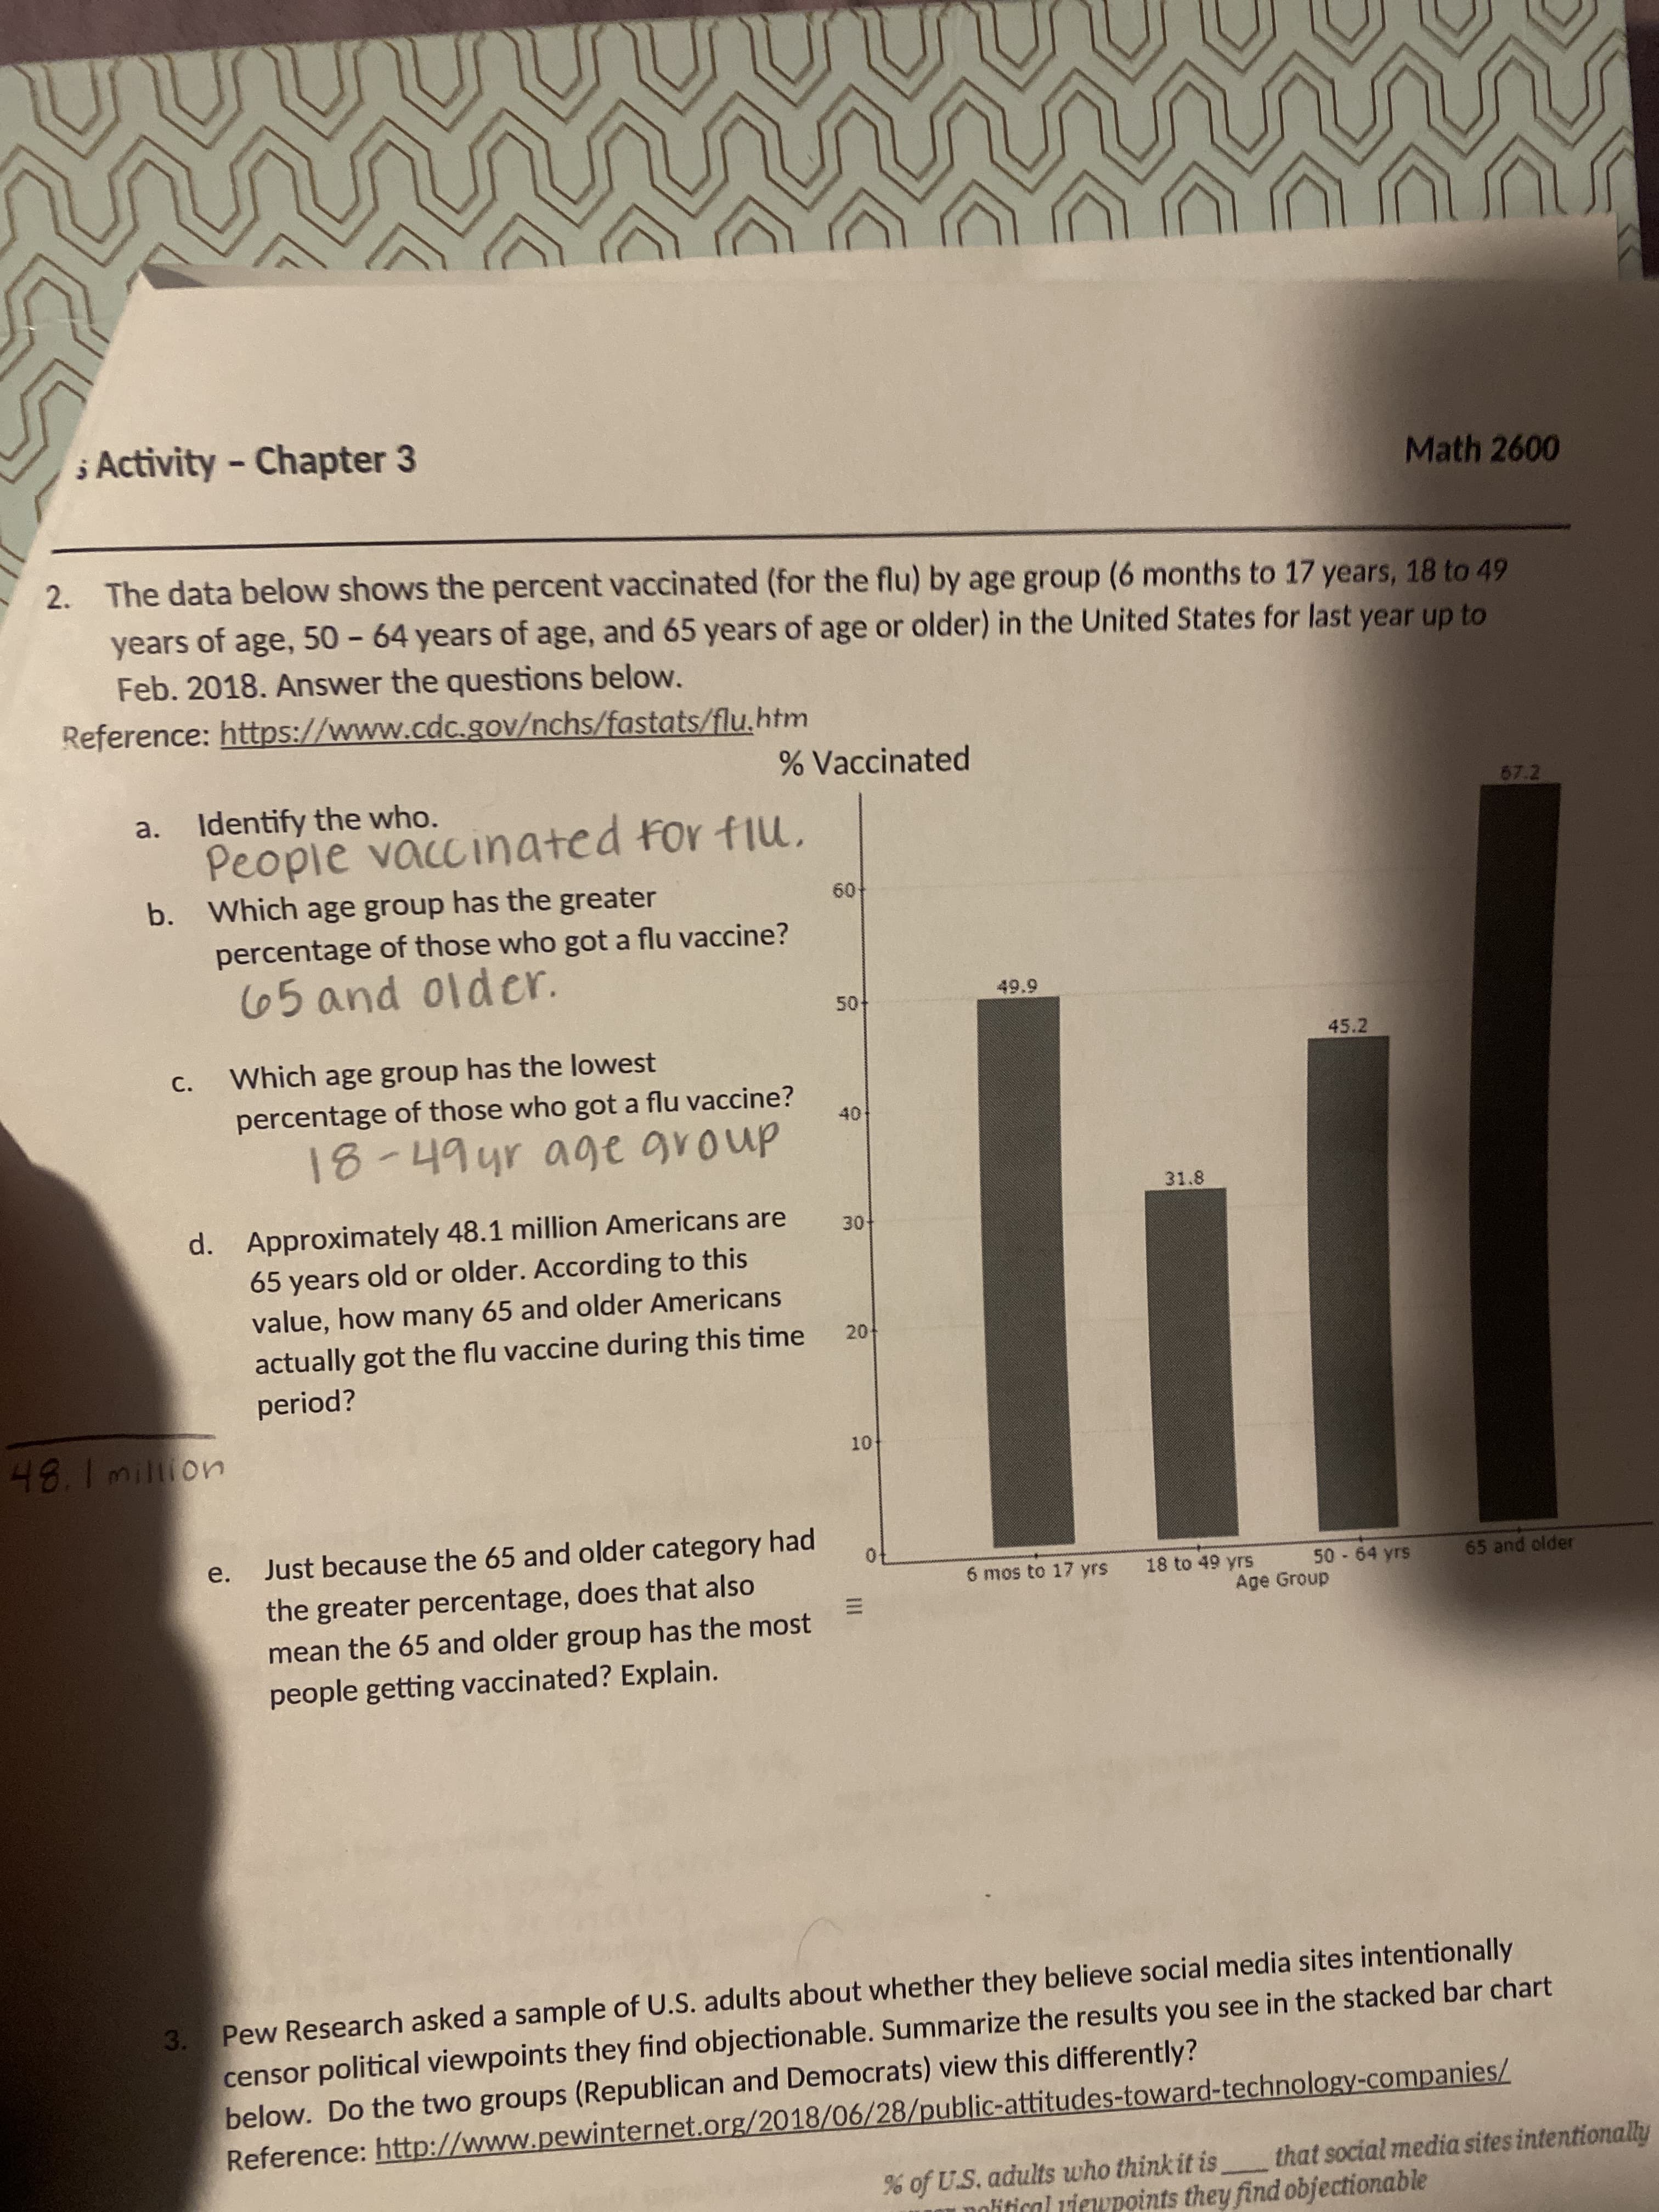
2. The data below shows the percent vaccinated (for the flu) by age group (6 months to 17 years, 18 to 49
years of age, 50 - 64 years of age, and 65 years of age or older) in the United States for last year up to
Feb. 2018. Answer the questions below.
Reference: https://www.cdc.gov/nchs/fastats/flu.htm
Vaccinated
Identify the who.
People vaccinated for flu,
b. Which age group has the greater
a.
09
percentage of those who got a flu vaccine?
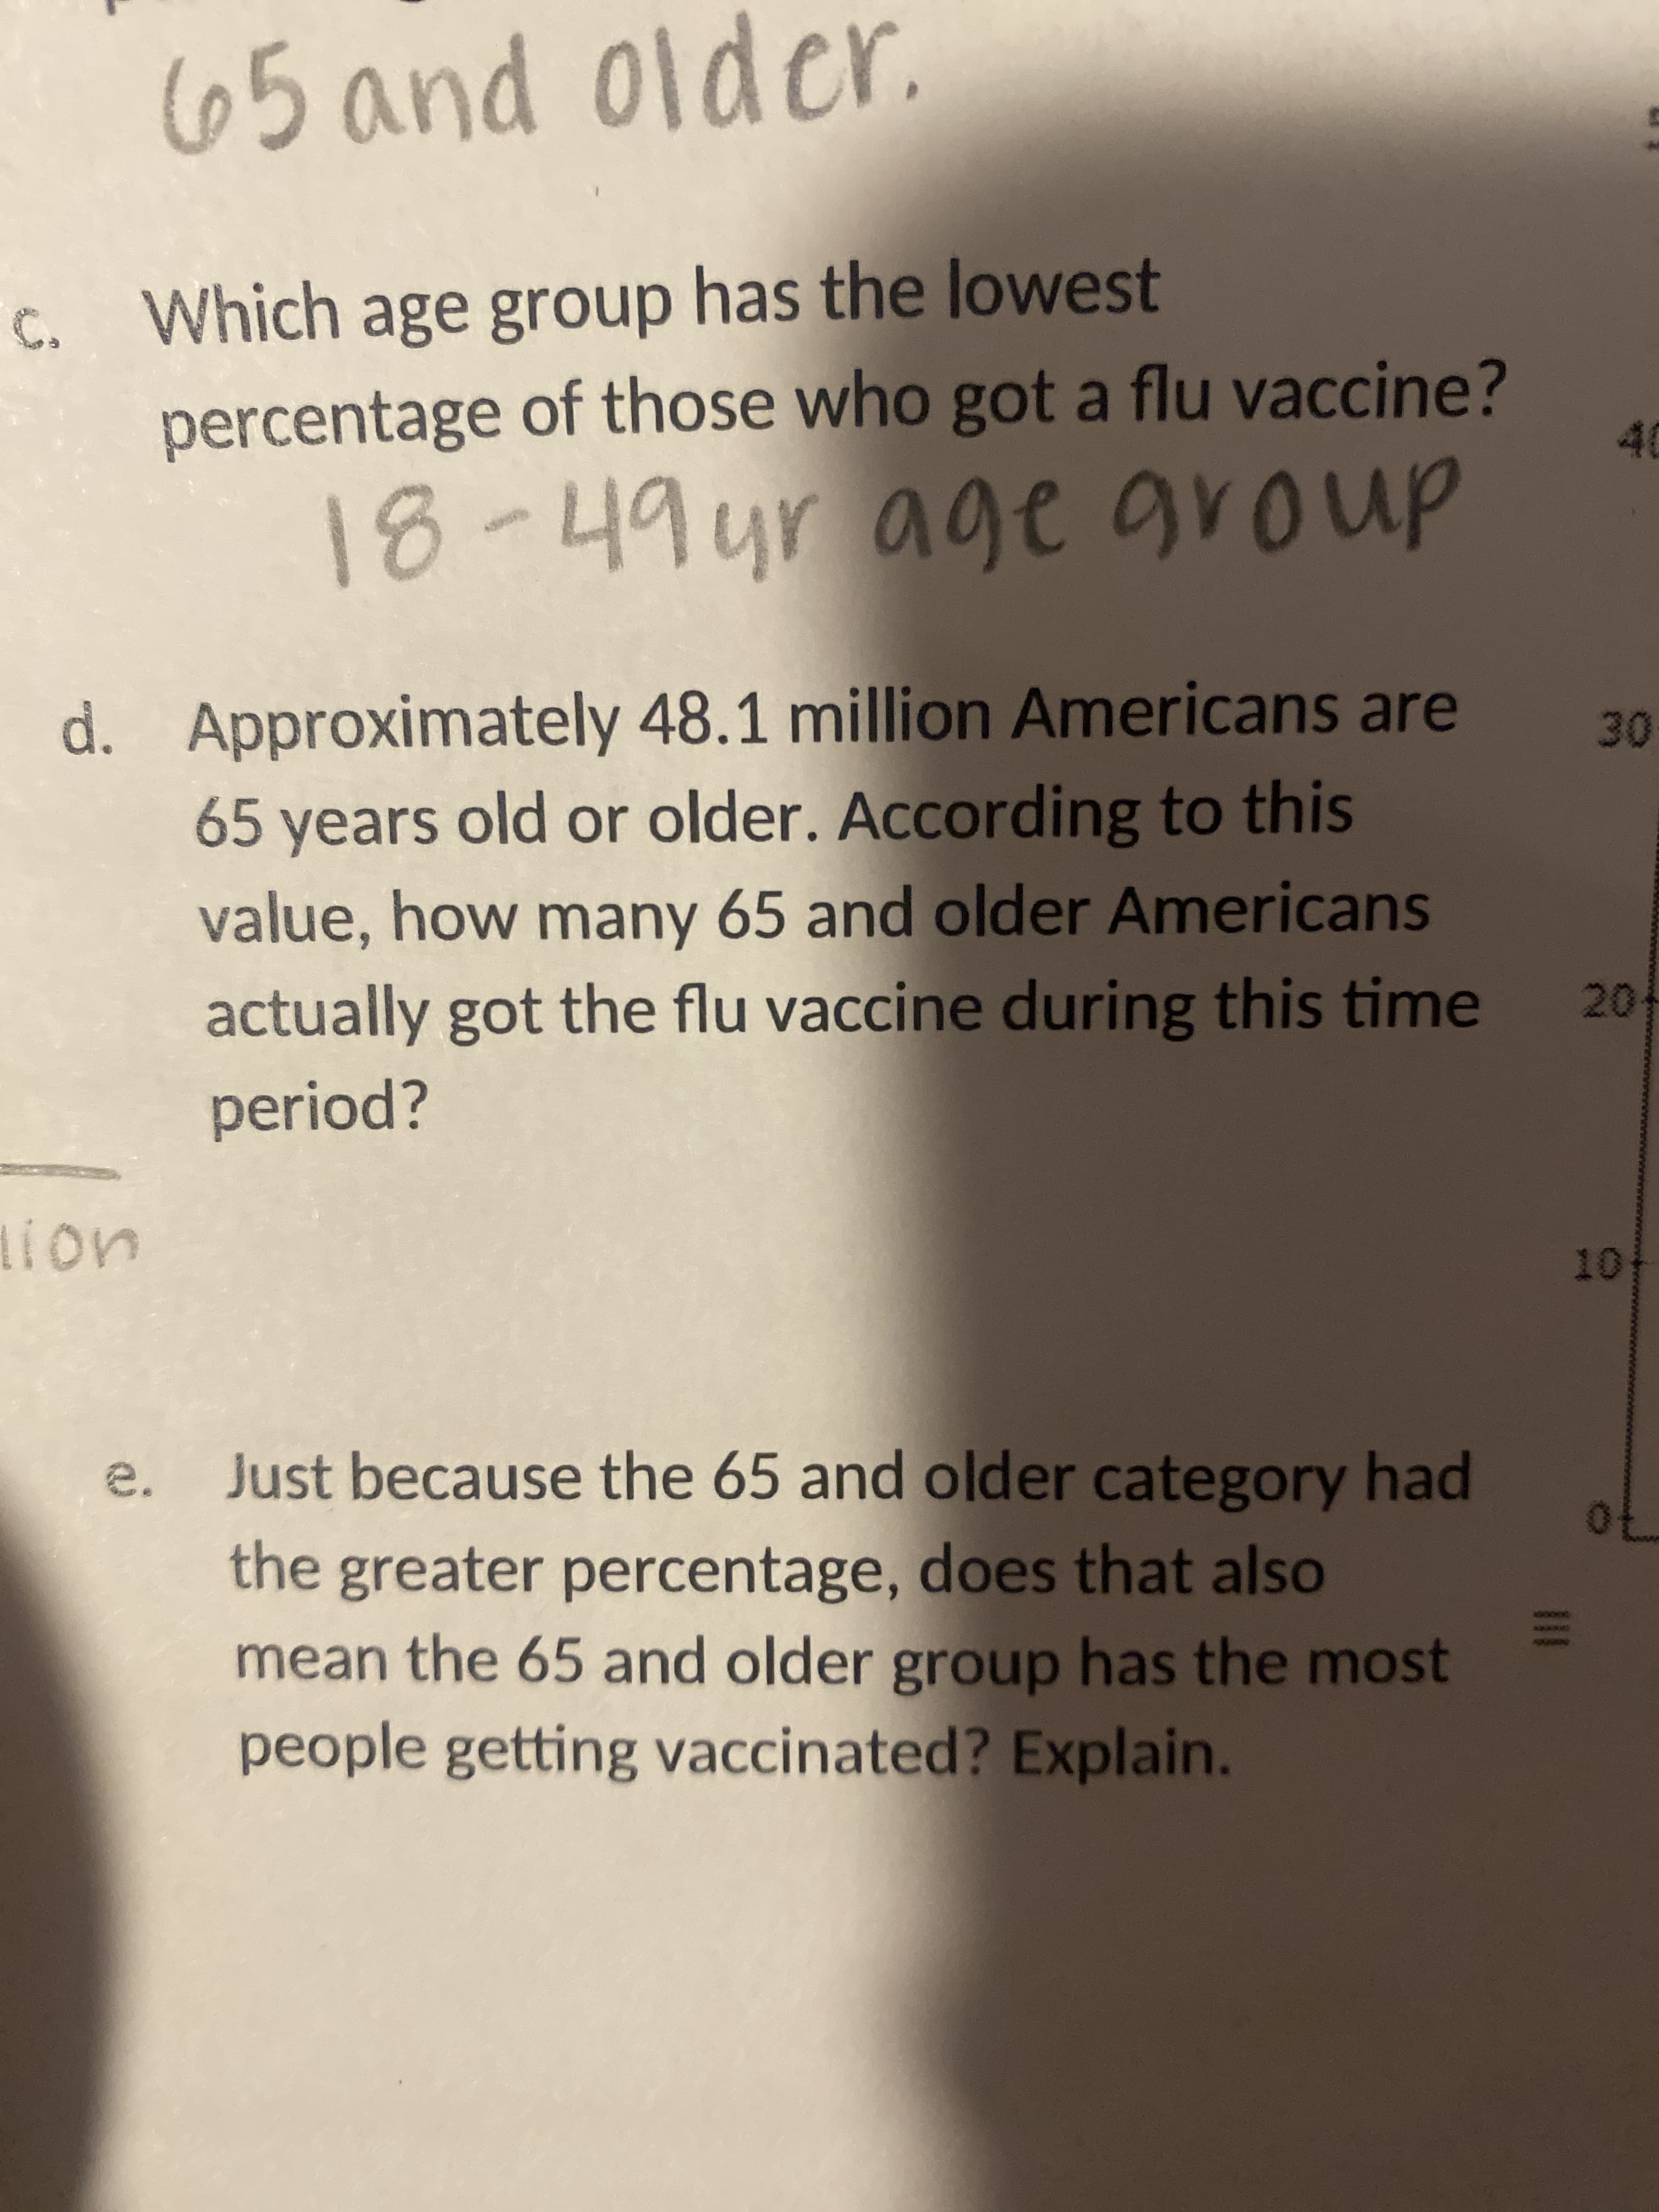
65 and older.
50+
C.
Which age group has the lowest
45.2
percentage of those who got a flu vaccine?
18-49yr age group
31.8
d. Approximately 48.1 million Americans are
65 years old or older. According to this
value, how many 65 and older Americans
actually got the flu vaccine during this time
301
201
period?
Just because the 65 and older category had
the greater percentage, does that also
mean the 65 and older group has the most
6 mos to 17 yrs
18 to 49 yrs
50 64 yrs
65 and older
Age Group
people getting vaccinated? Explain.
Pew Research asked a sample of U.S. adults about whether they believe social media sites intentionally
censor political viewpoints they find objectionable. Summarize the results you see in the stacked bar chart
below. Do the two groups (Republican and Democrats) view this differently?
Reference: http://www.pewinternet.org/2018/06/28/public-attitudes-toward-technology-companies/
3.
% of U.S. adults who think it is
nolitical viewpoints they find objectionable
that social media sites intentionally
Transcribed Image Text:665 and older.
Which age group has the lowest
percentage of those who got a flu vaccine?
b
18-49yr age group
40
d. Approximately 48.1 million Americans are
65 years old or older. According to this
value, how many 65 and older Americans
actually got the flu vaccine during this time
20+
period?
e.
Just because the 65 and older category had
the greater percentage, does that also
70
mean the 65 and older group has the most
11
people getting vaccinated? Explain.
Expert Solution
This question has been solved!
Explore an expertly crafted, step-by-step solution for a thorough understanding of key concepts.

Step by step
Solved in 3 steps with 2 images

Recommended textbooks for you
Linear Algebra: A Modern Introduction
Algebra
ISBN:
9781285463247
Author:
David Poole
Publisher:
Cengage Learning

Glencoe Algebra 1, Student Edition, 9780079039897…
Algebra
ISBN:
9780079039897
Author:
Carter
Publisher:
McGraw Hill

Linear Algebra: A Modern Introduction
Algebra
ISBN:
9781285463247
Author:
David Poole
Publisher:
Cengage Learning
Glencoe Algebra 1, Student Edition, 9780079039897…
Algebra
ISBN:
9780079039897
Author:
Carter
Publisher:
McGraw Hill

Big Ideas Math A Bridge To Success Algebra 1: Stu…
Algebra
ISBN:
9781680331141
Author:
HOUGHTON MIFFLIN HARCOURT
Publisher:
Houghton Mifflin Harcourt