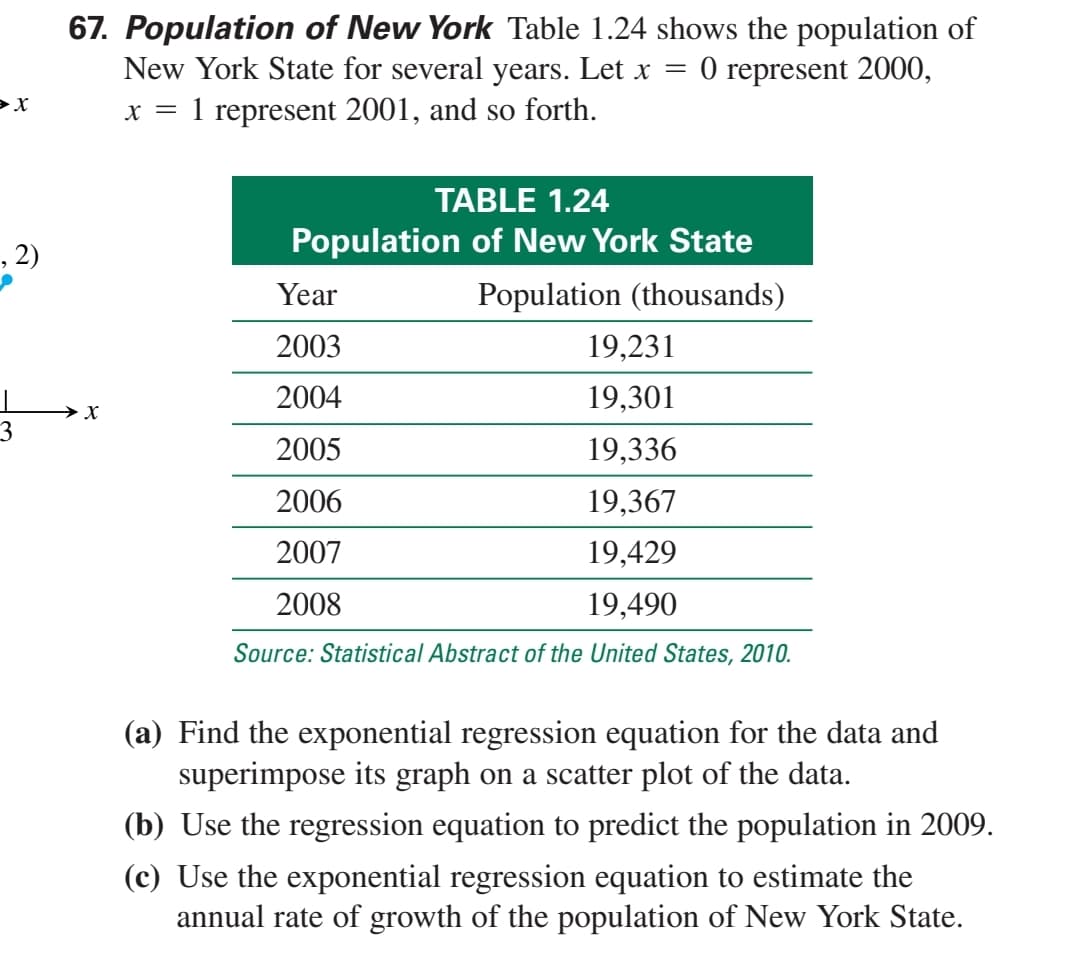
67. Population of New York Table 1.24 shows the population of New York State for several years. Let x = 0 represent 2000, x = 1 represent 2001, and so forth. TABLE 1.24 Population of New York State Year Population (thousands) 2003 19,231 2004 19,301 →X 2005 19,336 2006 19,367 2007 19,429 2008 19,490 Source: Statistical Abstract of the United States, 2010. (a) Find the exponential regression equation for the data and superimpose its graph on a scatter plot of the data. (b) Use the regression equation to predict the population in 2009. (c) Use the exponential regression equation to estimate the annual rate of growth of the population of New York State.
67. Population of New York Table 1.24 shows the population of New York State for several years. Let x = 0 represent 2000, x = 1 represent 2001, and so forth. TABLE 1.24 Population of New York State Year Population (thousands) 2003 19,231 2004 19,301 →X 2005 19,336 2006 19,367 2007 19,429 2008 19,490 Source: Statistical Abstract of the United States, 2010. (a) Find the exponential regression equation for the data and superimpose its graph on a scatter plot of the data. (b) Use the regression equation to predict the population in 2009. (c) Use the exponential regression equation to estimate the annual rate of growth of the population of New York State.

Elementary Linear Algebra (MindTap Course List)
8th Edition
ISBN:9781305658004
Author:Ron Larson
Publisher:Ron Larson
Chapter7: Eigenvalues And Eigenvectors
Section7.CM: Cumulative Review
Problem 30CM

Related questions
Question
Transcribed Image Text:67. Population of New York Table 1.24 shows the population of
New York State for several years. Let x =
O represent 2000,
x = 1 represent 2001, and so forth.
TABLE 1.24
, 2)
Population of New York State
Year
Population (thousands)
2003
19,231
2004
19,301
3
2005
19,336
2006
19,367
2007
19,429
2008
19,490
Source: Statistical Abstract of the United States, 2010.
(a) Find the exponential regression equation for the data and
superimpose its graph on a scatter plot of the data.
(b) Use the regression equation to predict the population in 2009.
(c) Use the exponential regression equation to estimate the
annual rate of growth of the population of New York State.
Expert Solution
This question has been solved!
Explore an expertly crafted, step-by-step solution for a thorough understanding of key concepts.

This is a popular solution!

Trending now
This is a popular solution!

Step by step
Solved in 4 steps with 1 images

Knowledge Booster


Learn more about
Need a deep-dive on the concept behind this application? Look no further. Learn more about this topic, statistics and related others by exploring similar questions and additional content below.Recommended textbooks for you
Elementary Linear Algebra (MindTap Course List)
Algebra
ISBN:
9781305658004
Author:
Ron Larson
Publisher:
Cengage Learning

Holt Mcdougal Larson Pre-algebra: Student Edition…
Algebra
ISBN:
9780547587776
Author:
HOLT MCDOUGAL
Publisher:
HOLT MCDOUGAL

Algebra & Trigonometry with Analytic Geometry
Algebra
ISBN:
9781133382119
Author:
Swokowski
Publisher:
Cengage
Elementary Linear Algebra (MindTap Course List)
Algebra
ISBN:
9781305658004
Author:
Ron Larson
Publisher:
Cengage Learning
Holt Mcdougal Larson Pre-algebra: Student Edition…
Algebra
ISBN:
9780547587776
Author:
HOLT MCDOUGAL
Publisher:
HOLT MCDOUGAL
Algebra & Trigonometry with Analytic Geometry
Algebra
ISBN:
9781133382119
Author:
Swokowski
Publisher:
Cengage