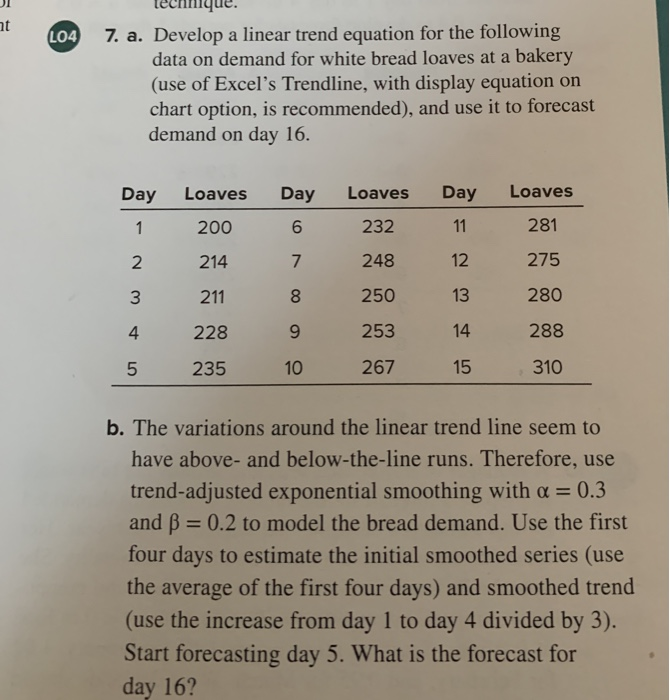
7. a. Develop a linear trend equation for the following data on demand for white bread loaves at a bakery (use of Excel's Trendline, with display equation on chart option, is recommended), and use it to forecast demand on day 16. Day Loaves Day 1 200 6 2 214 7 3 211 8 228 9 235 10 4 5 Loaves 232 248 250 253 267 Day 11 12 13 14 15 Loaves 281 275 280 288 310 b. The variations around the linear trend line seem to have above- and below-the-line runs. Therefore, use trend-adjusted exponential smoothing with a = 0.3 and ß = 0.2 to model the bread demand. Use the first four days to estimate the initial smoothed series (use the average of the first four days) and smoothed trend (use the increase from day 1 to day 4 divided by 3). Start forecasting day 5. What is the forecast for day 16?
7. a. Develop a linear trend equation for the following data on demand for white bread loaves at a bakery (use of Excel's Trendline, with display equation on chart option, is recommended), and use it to forecast demand on day 16. Day Loaves Day 1 200 6 2 214 7 3 211 8 228 9 235 10 4 5 Loaves 232 248 250 253 267 Day 11 12 13 14 15 Loaves 281 275 280 288 310 b. The variations around the linear trend line seem to have above- and below-the-line runs. Therefore, use trend-adjusted exponential smoothing with a = 0.3 and ß = 0.2 to model the bread demand. Use the first four days to estimate the initial smoothed series (use the average of the first four days) and smoothed trend (use the increase from day 1 to day 4 divided by 3). Start forecasting day 5. What is the forecast for day 16?

Glencoe Algebra 1, Student Edition, 9780079039897, 0079039898, 2018
18th Edition
ISBN:9780079039897
Author:Carter
Publisher:Carter
Chapter10: Statistics
Section10.6: Summarizing Categorical Data
Problem 23PPS

Related questions
Question
Transcribed Image Text:ht
LO4 7. a. Develop a linear trend equation for the following
data on demand for white bread loaves at a bakery
(use of Excel's Trendline, with display equation on
chart option, is recommended), and use it to forecast
demand on day 16.
Day
1
2
3
4
5
Loaves Day
200
6
214
7
211
8
228
9
235
10
Loaves
232
248
250
253
267
Day
11
12
13
14
15
Loaves
281
275
280
288
310
b. The variations around the linear trend line seem to
have above- and below-the-line runs. Therefore, use
trend-adjusted exponential smoothing with a = 0.3
and ß = 0.2 to model the bread demand. Use the first
four days to estimate the initial smoothed series (use
the average of the first four days) and smoothed trend
(use the increase from day 1 to day 4 divided by 3).
Start forecasting day 5. What is the forecast for
day 16?
Expert Solution
This question has been solved!
Explore an expertly crafted, step-by-step solution for a thorough understanding of key concepts.

Step by step
Solved in 4 steps with 17 images

Recommended textbooks for you
Glencoe Algebra 1, Student Edition, 9780079039897…
Algebra
ISBN:
9780079039897
Author:
Carter
Publisher:
McGraw Hill

Big Ideas Math A Bridge To Success Algebra 1: Stu…
Algebra
ISBN:
9781680331141
Author:
HOUGHTON MIFFLIN HARCOURT
Publisher:
Houghton Mifflin Harcourt
Glencoe Algebra 1, Student Edition, 9780079039897…
Algebra
ISBN:
9780079039897
Author:
Carter
Publisher:
McGraw Hill
Big Ideas Math A Bridge To Success Algebra 1: Stu…
Algebra
ISBN:
9781680331141
Author:
HOUGHTON MIFFLIN HARCOURT
Publisher:
Houghton Mifflin Harcourt