7. Fill in the table with the necessary data to calculate the variance of the sampling distribution of the sample means using the formula: = population mean x= sample mean P(X) = probability of the sample mean where Means (X) P(X) (X - p)² P(X) * ( X - u )² P(X) • (X - u = 8. Draw the histogram of the sampling distribution of the sample means. 9. Answer the following questions: a. What can you say about the mean of the sample means and the mean of the populstion? Answer b. What can you say about the variance of the sample means and the variance of the population Answer
7. Fill in the table with the necessary data to calculate the variance of the sampling distribution of the sample means using the formula: = population mean x= sample mean P(X) = probability of the sample mean where Means (X) P(X) (X - p)² P(X) * ( X - u )² P(X) • (X - u = 8. Draw the histogram of the sampling distribution of the sample means. 9. Answer the following questions: a. What can you say about the mean of the sample means and the mean of the populstion? Answer b. What can you say about the variance of the sample means and the variance of the population Answer

Glencoe Algebra 1, Student Edition, 9780079039897, 0079039898, 2018
18th Edition
ISBN:9780079039897
Author:Carter
Publisher:Carter
Chapter10: Statistics
Section10.4: Distributions Of Data
Problem 19PFA

Related questions
Question
7,8,9
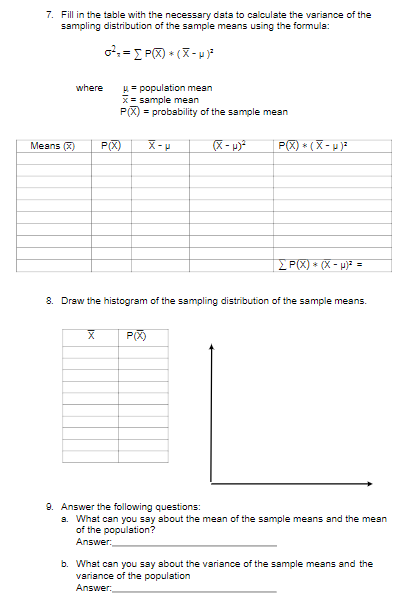
Transcribed Image Text:7. Fill in the table with the necessary data to calculate the variance of the
sampling distribution of the sample means using the formula:
where
= population mean
x= sample mean
P(X) = probability of the sample mean
Means (X)
P(X)
P(X) * ( X- u )?
P(X) * (X - p)? =
8. Draw the histogram of the sampling distribution of the sample means.
P(X)
9. Answer the following questions:
a. What can you say about the mean of the sample means sand the mean
of the population?
Answer
b. What can you say about the variance of the sample means and the
variance of the population
Answer:
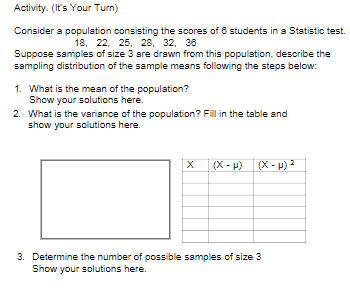
Transcribed Image Text:Activity. (It's Your Turn)
Consider a population consisting the scores of 8 students in a Statistic test.
18, 22. 25, 28, 32, 38
Suppose samples of size 3 are drawn from this population, describe the
sampling distribution of the sample means following the steps below:
1. What is the mean of the population?
Show your solutions here.
2. What is the variance of the population? Fill in the table and
show your solutions here.
(X - P)
(X - H) ?
3. Determine the number of possible samples of size 3
Show your solutions here.
Expert Solution
This question has been solved!
Explore an expertly crafted, step-by-step solution for a thorough understanding of key concepts.

Step by step
Solved in 6 steps with 6 images

Recommended textbooks for you
Glencoe Algebra 1, Student Edition, 9780079039897…
Algebra
ISBN:
9780079039897
Author:
Carter
Publisher:
McGraw Hill

Algebra & Trigonometry with Analytic Geometry
Algebra
ISBN:
9781133382119
Author:
Swokowski
Publisher:
Cengage
Glencoe Algebra 1, Student Edition, 9780079039897…
Algebra
ISBN:
9780079039897
Author:
Carter
Publisher:
McGraw Hill
Algebra & Trigonometry with Analytic Geometry
Algebra
ISBN:
9781133382119
Author:
Swokowski
Publisher:
Cengage