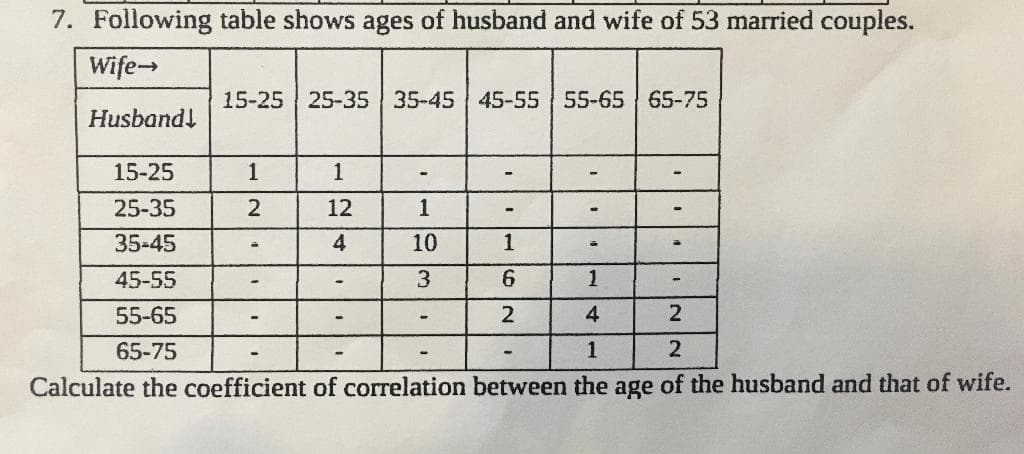
7. Following table shows ages of husband and wife of 53 married couples. Wife→ 15-25 25-35 35-45 45-55 55-65 65-75 Husband! 15-25 1 25-35 2 12 1 35-45 4 10 1 45-55 3 6. 55-65 2 4 65-75 1 Calculate the coefficient of correlation between the age of the husband and that of wife.
Q: A random sample of 100 employees at a company shows that 62 are female. Form a 95% confidence…
A:
Q: A sample of 14 television tubes produced by a company showed a mean lifetime of 1838 hours and a…
A: Given that, n=14σ=233x¯=1838 The formula for calculating the standard deviation of the population of…
Q: Suppose that you are to conduct the following hypothesis test: H0:p≥0.49 H1:p<0.49 A sample of…
A:
Q: The Consumer Price Index (CPI) is a measure of the average change in price over time from a…
A: From the given information we find the car value in 2012
Q: A consumer product researcher wanted to find out whether a highlighter lasted less than the…
A: The following information has been given: The population mean is μ=15. The sample size is n=35. The…
Q: Assuming a Normal Distribution, find the probability of a product failing: - i) After less than…
A:
Q: The graph illustrates a normal distribution for the prices paid for a particular model of HD…
A: We have given that, From the normal curve, Population mean (μ) = 1600 and standard deviation (σ) =…
Q: The regression equation for Y is the linear equation Ý = bX + a %3D where Sy b =r М, — b. М. & a =…
A: A least square regression line is called the line of best fit.
Q: Here are summary statistics for randomly selected weights of newborn girls: n= 232, *= 32.2 hg,…
A: Given n=232 Mean=32.2 Standard deviations=7.4
Q: In a random sample of 296 people, 179 said that they watched educational television. Find the upper…
A:
Q: a. Find D4, P33,Q1 b. Variance
A: Given: Number of observations, n=30 observations 3.46 3.72 3.95 3.55 3.62 3.8 3.86…
Q: 8. The regression equations of two variables x and y are x = 0.7y + 5.2, y = 0.3x +2.8. Find the…
A: 8. The provided regression equation is x=0.7y+5.2 ----------(this is equation 1) and y=0.3x+2.8…
Q: Which of the following is a bootstrap sample from the sample values: 5,8, 13, 20, 25, 29
A: Option (ii) is the correct answer.
Q: Cotinine (ngmLD 0-99 100-190 Refer to the tabie to the right summatzing measured amounts of serum…
A: Solution:- from given information Cotinine frequency 0-99 15 100-199 14 200-299 16…
Q: College Units Frequency 0-24 4 25-49 Find the standard deviation for the grouped data. 50-74 75-99 3…
A:
Q: group of 10 students from elementary school has their height measured. The sample mean is 166 cm and…
A:
Q: ample 8•10. A computer while calculating correlation coefficient between two variables X and Y from…
A: Given that We have to find the corrected correlation coefficient
Q: 3. Use the t-distribution table to determine the value of t to construct a confidence interval for…
A: Given a. C = 95% n = 18 b. C = 90% n = 29 c. C = 98% n = 45 d. C = 99.5% n = 76 e. C = 99.9% n =…
Q: Find the critical value given the information below. 1. Two-tailed test, variance is known a= 0.01 ,…
A: As per company guidelines I solved exactly three subparts of the question.thank you
Q: Explain the role of Statistics in biological science.
A: Statistics is a part of mathematics that involves collecting data, its study, analysis, and…
Q: Which of the following changes we would expect to result in a reduced interval width (select the…
A: We have given that The 90% confidence interval is (1000, 2100).
Q: Suppose that we are to conduct the following hypothesis test: H0:p=0.34 H1:p≠0.34 Sampling…
A:
Q: Suppose that you are to conduct the following hypothesis test: H0:μ≤8 H1:μ>8 A sample of 15…
A:
Q: Given the following data and using Jamovi, test (at an alpha of 0.05) whether type of music…
A: Repeated measure ANOVA is one type of ANOVA.
Q: Use the table below to find the percentage of data items in a normal distribution that lie a. below…
A: The given normal distribution table is, From the table, (a) The percentage of data items that lie…
Q: bility of randomly selecting a smartphone user and getting a response other than "yes" is teger or a…
A: Given P(A)=0.83
Q: certain dog can catch a properly thrown tennis ball with a probability of 0.95. unfortunately, this…
A: Given that, a certain dog can catch a properly thrown tennis ball with a probability of 0.95.…
Q: ample 8.1(). A computer while calculating correlation coefficient between two variables X and Y from…
A: Given that We have to find the corrected correlation coefficient...
Q: Please answer question 7
A: Hai
Q: random sample of 25 men’s resting pulse rates shows a mean of 72 beats per minute and a standard…
A:
Q: A pediatrician has three patients with measles and they are ages 2, 4, and 12. Assume that samples…
A: For the given data Find all the required blanks
Q: Which among the groups is most dispersed? Support your answer.
A: here use given mean and standard deviation
Q: An examinee of the National Medical Admission Test (NMAT) got a percentile rank of 95%. What does…
A: An examinee gives a National Medical Admission Test(NMAT) and got a percentile rank of 95% in it.
Q: 1. If the variance is known, the sample is 800, and the level of significance is 0.01, what is the…
A: For known variance ,z for unknown variance, t
Q: A chord of a circle of radius a is drawn parallel to a given straight line, all distances from the…
A:
Q: Given the following results of the height and weight of 1,000 men students : 3- 68", X-150 lbs,…
A: The following information has been : The total sample size n=1000. The mean y¯=68. The mean x¯=150…
Q: 2. Why do we use samples in the collection of data?
A: Sample is a small group of data that is selected from the larger population.
Q: 2. Is smoking during pregnancy associated with premature births? To investigate this question,…
A:
Q: Different groups of consumers are intercepted in shopping malls at the end of every month, for a…
A: Panel data Panel data is also referred to as longitudinal data. It contains observations across…
Q: Burger Queen is conducting a study at its Linstead branch. Data of number of cars that orders at its…
A: We are required to simulate the number of cars that had arrived at the Burger Queen drive-through on…
Q: group took 40 mg of ginkgo 3 times a day for 6 weeks. The 115 participants assigned to the control…
A:
Q: 5. To check the spread of disease of a salmon at a fish farm in BC the manager wants to inspect 10%…
A: Manager wants to inspect 10 % of fish in farm. We have to find out sampling technique for each…
Q: 4. (Calculating the Standard Deviation Question) Calculate the sample standard deviation of the…
A:
Q: -Question Completion Status: O d. ANOVA QUESTION 8 The calculated value for your Chi Square…
A: We have given that Calculated Chi-Square value = 9.34 Degrees of freedom = 4 Significance level =…
Q: Consider the game in strategic form defined by the following payoff functions: U1(t1,t2) = [10 +…
A:
Q: Write a textual presentation of Table 1.
A: Frequency distribution is a way of organizing data.
Q: "there was ne streng evidence" that the prepertion of women whe became pregnant while taking HGH…
A:
Q: Set up a 95% confidence interval for the determining the number of shoppers at the 40° temperature.…
A: From the given information we find 95% confidence interval.
Q: 2- A radio station conducts a poll about gun control. It invites listeners to call one phone number…
A:
Q: What are the benefits of researchers and students utilizing secondary analysis
A: One of the major benefits of using secondary analysis is that it is cost effective. There is no need…
Trending now
This is a popular solution!
Step by step
Solved in 5 steps with 5 images
- Suppose a friend of yours computes a correlation coefficient of +1.10 and comes to you for advice as to how to interpret it. What would you tell your friend?1. If someone owns an electric car it is represented by a one and if they don’t it is represented by a zero. If someone owns an electric car and their yearly salary in pounds for four people are (0,80000), (0, 17000), (0, 37000) and (1, 58000) calculate the correlation coefficient.A manager of a company wants to study the correlation between the amount of salary and the efficiency ratings of his employees. A random sample of 12 employees were selected and shows that the correlation coefficient r is 0.9512. It can be concluded that: There is a [a] correlation between the amount of salary and efficiency ratings – that means, an increase in the amount of salary is highly associated with the [b] in efficiency ratings. A. very high positive; decrease B. moderately high positive; decrease C. very high positive; increase D. moderately high positive; increase
- Suppose the Pearson correlation between X and Y is -0.4567. Now I create a new variable Z = 4 - 8*X, then what is the Pearson correlation between Z and Y?Suppose Z ~ N(0,1). What is the correlation between Z and |Z|1. If someone owns an electric car it is represented by a one and if they don’t it is represented by a zero. If someone owns an electric car and their yearly salary in pounds for four people are (0,80000), (0, 17000), (0, 37000) and (1, 58000) calculate the correlation coefficient.2. How might we interpret this result?
- What would be an example of an impossible correlation coefficient? In other words, give a value of r that would lead you to suspect that the researcher made a mistake.If there is a correlation between X and Y, and if X occurs before Y, it is possible that X causes Y or that the relation of X and Y is due to?For a correlation of -.64 between X and Y, each 1 _SD change in Zx corresponds to a predicted change of _____________SD in Zy.