7. Here are allele frequencies for the black allele (f (y)) in 2010 and 2020 for island A and the mainland. 2010 2020 0.39 0.77 Island A 0.26 Mainland 0.77 Give an estimate of the rate of migration into island A from the mainland for this time interval, given the allele frequencies observed. (A) 0.0
7. Here are allele frequencies for the black allele (f (y)) in 2010 and 2020 for island A and the mainland. 2010 2020 0.39 0.77 Island A 0.26 Mainland 0.77 Give an estimate of the rate of migration into island A from the mainland for this time interval, given the allele frequencies observed. (A) 0.0

Biology (MindTap Course List)
11th Edition
ISBN:9781337392938
Author:Eldra Solomon, Charles Martin, Diana W. Martin, Linda R. Berg
Publisher:Eldra Solomon, Charles Martin, Diana W. Martin, Linda R. Berg
Chapter19: Evolutionary Change In Populations
Section: Chapter Questions
Problem 1TYU: The genetic description of an individual is its genotype, whereas the genetic description of a...

Related questions
Question
I need help answering these questions. The table census table is provided to answer question 8.
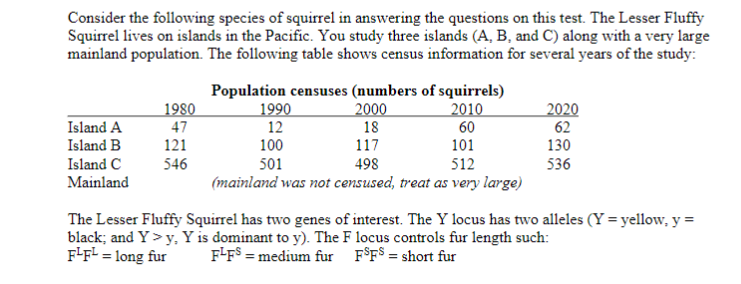
Transcribed Image Text:Consider the following species of squirrel in answering the questions on this test. The Lesser Fluffy
Squirrel lives on islands in the Pacific. You study three islands (A, B, and C) along with a very large
mainland population. The following table shows census information for several years of the study:
Island A
Island B
Island C
1980
47
121
Population censuses (numbers of squirrels)
2000
18
117
1990
12
100
501
2010
60
101
2020
62
130
546
498
512
536
Mainland
(mainland was not censused, treat as very large)
The Lesser Fluffy Squirrel has two genes of interest. The Y locus has two alleles (Y = yellow, y =
black; and Y> y, Y is dominant to y).. The F locus controls fur length such:
F-F² = long fur
F-F$ = medium fur F$F$ = short fur
%3D
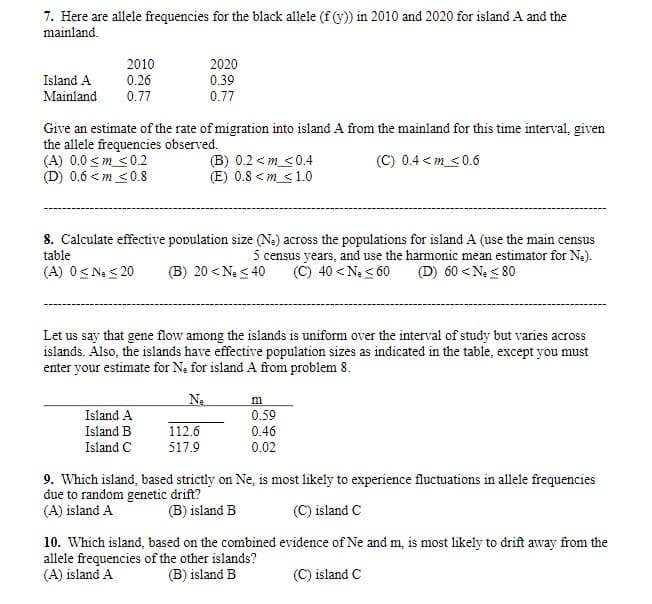
Transcribed Image Text:7. Here are allele frequencies for the black allele (f (y)) in 2010 and 2020 for island A and the
mainland.
2010
0.26
0.77
2020
Island A
0.39
Mainland
0.77
Give an estimate of the rate of migration into island A from the mainland for this time interval, given
the allele frequencies observed.
(A) 0.0 <m <0.2
(D) 0.6 < m <0.8
(B) 0.2 <m_<0.4
(E) 0.8 <m_<1.0
(C) 0.4 <m_<0.6
8. Calculate effective population size (Na) across the populations for island A (use the main census
5 census years, and use the harmonic mean estimator for Ne).
(C) 40 < Ne < 60
table
(A) O< Ne < 20
(B) 20 < Ne < 40
(D) 60 < N < 80
Let us say that gene flow among the islands is uniform over the interval of study but varies across
islands. Also, the islands have effective population sizes as indicated in the table, except you must
enter your estimate for Na for island A from problem 8.
Ne
m
Island A
0.59
Island B
112.6
0.46
Island C
517.9
0.02
9. Which island, based strictly on Ne, is most likely to experience fluctuations in allele frequencies
đue to random genetic drift?
(A) island A
(B) island B
(C) island C
10. Which island, based on the combined evidence of Ne and m, is most likely to drift away from the
allele frequencies of the other islands?
(A) island A
(B) island B
(C) island C
Expert Solution
This question has been solved!
Explore an expertly crafted, step-by-step solution for a thorough understanding of key concepts.

This is a popular solution!

Trending now
This is a popular solution!

Step by step
Solved in 3 steps

Knowledge Booster


Learn more about
Need a deep-dive on the concept behind this application? Look no further. Learn more about this topic, biology and related others by exploring similar questions and additional content below.Recommended textbooks for you
Biology (MindTap Course List)
Biology
ISBN:
9781337392938
Author:
Eldra Solomon, Charles Martin, Diana W. Martin, Linda R. Berg
Publisher:
Cengage Learning

Biology 2e
Biology
ISBN:
9781947172517
Author:
Matthew Douglas, Jung Choi, Mary Ann Clark
Publisher:
OpenStax

Biology: The Dynamic Science (MindTap Course List)
Biology
ISBN:
9781305389892
Author:
Peter J. Russell, Paul E. Hertz, Beverly McMillan
Publisher:
Cengage Learning
Biology (MindTap Course List)
Biology
ISBN:
9781337392938
Author:
Eldra Solomon, Charles Martin, Diana W. Martin, Linda R. Berg
Publisher:
Cengage Learning
Biology 2e
Biology
ISBN:
9781947172517
Author:
Matthew Douglas, Jung Choi, Mary Ann Clark
Publisher:
OpenStax
Biology: The Dynamic Science (MindTap Course List)
Biology
ISBN:
9781305389892
Author:
Peter J. Russell, Paul E. Hertz, Beverly McMillan
Publisher:
Cengage Learning

Biology: The Unity and Diversity of Life (MindTap…
Biology
ISBN:
9781305073951
Author:
Cecie Starr, Ralph Taggart, Christine Evers, Lisa Starr
Publisher:
Cengage Learning