7. In pea plants, green seeds (G) are dominant over yellow seeds (g). In a cross between two plants both heterozygous for seed color, the following was observed: (Show all work) Green: 4400 Yellow: 1624 NULL: Does the data fit the predicted phenotypic ratio?
7. In pea plants, green seeds (G) are dominant over yellow seeds (g). In a cross between two plants both heterozygous for seed color, the following was observed: (Show all work) Green: 4400 Yellow: 1624 NULL: Does the data fit the predicted phenotypic ratio?

Human Heredity: Principles and Issues (MindTap Course List)
11th Edition
ISBN:9781305251052
Author:Michael Cummings
Publisher:Michael Cummings
Chapter3: Transmission Of Genes From Generation To Generation
Section: Chapter Questions
Problem 22QP: More Crosses with Pea Plants: The Principle of Independent Assortment In pea plants, long stems are...

Related questions

Question
Answer 7 with the table please

Transcribed Image Text:Format Tools Add-ons Help
Last edit was 2 minutes ago
Normal text
Times
BIUA
10
+
1
7. In pea plants, green seeds (G) are dominant over yellow seeds (g). In a cross between two plants both
heterozygous for seed color, the following was observed: (Show all work)
Green: 4400
Yellow: 1624
NULL:
Does the data fit the predicted phenotypic ratio?
8. In peas, tall plants (T) are dominant over short plants (t). In the P generation, a plant homozygous for tall height
is crossed with a short plant. The resulting F1 plants are crossed. The plant heights of the observed F2 generation
were: (Show all work) 3:1
Tall: 5474
Short: 1850
NULL
Support | Schoology Blog | PRIVACY POLIC
!!!
Expert Solution
Step 1
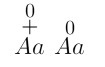
| A | a | |
| A | AA | Aa |
| a | Aa | aa |
A = Yellow
a = green
Expected Phenotypic ratio 3:1
Yellow : green
| Phenotype | Observed (O) | Expected (E) | O-E | (O-E)2 |  |
| Yellow | 4400 | 6024(.75) 4158 | -118 | 13924 | 3.08 |
| Green | 1624 | 6024(.25) 1506 | -118 | 13924 | 9.24 |
| Totals | 6024 | 6024 | 12.34 |

Trending now
This is a popular solution!

Step by step
Solved in 2 steps with 2 images

Knowledge Booster


Learn more about
Need a deep-dive on the concept behind this application? Look no further. Learn more about this topic, biology and related others by exploring similar questions and additional content below.Recommended textbooks for you
Human Heredity: Principles and Issues (MindTap Co…
Biology
ISBN:
9781305251052
Author:
Michael Cummings
Publisher:
Cengage Learning
Human Heredity: Principles and Issues (MindTap Co…
Biology
ISBN:
9781305251052
Author:
Michael Cummings
Publisher:
Cengage Learning