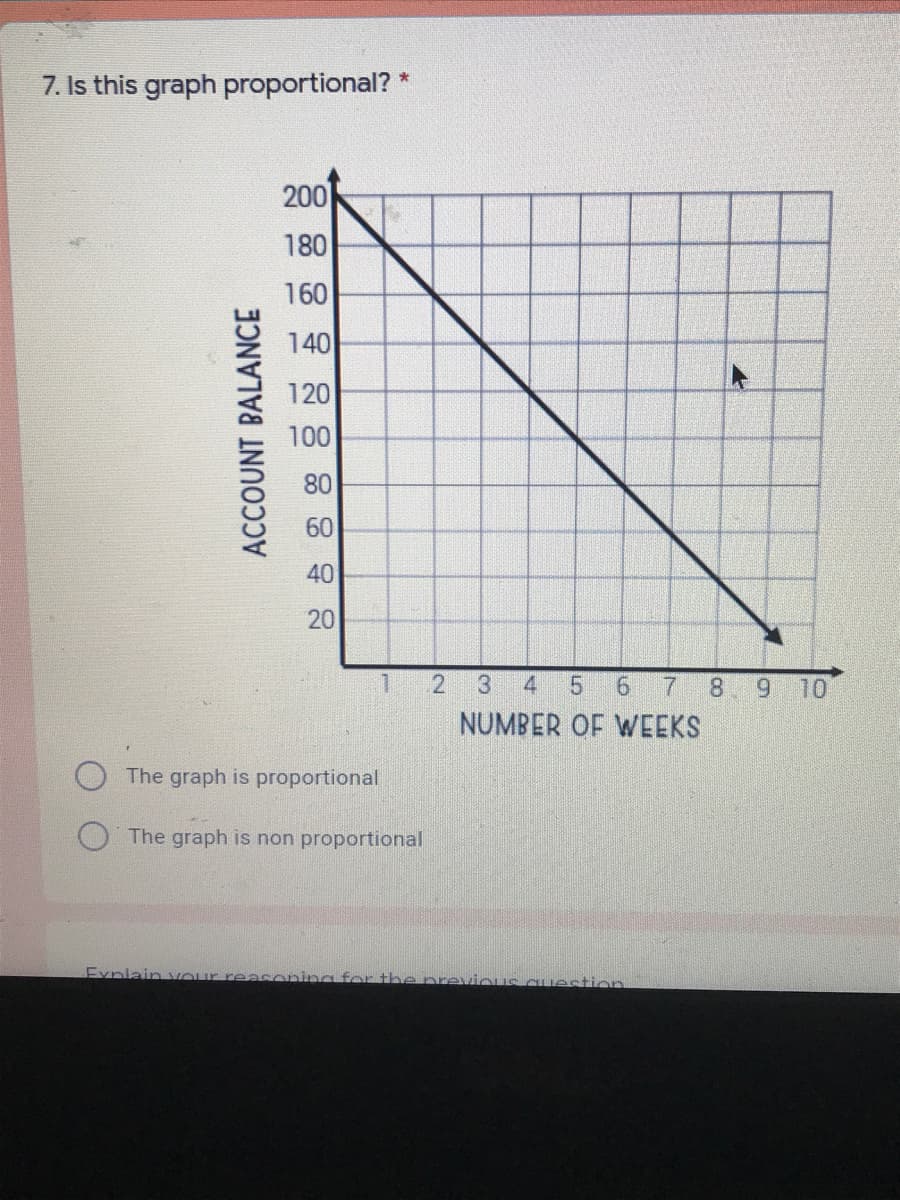
7. Is this graph proportional? * 200 180 160 140 120 100 80 60 40 20 1 2 4 5 6 7 8.9 10 NUMBER OF WEEKS The graph is proportional O The graph is non proportional ACCOUNT BALANCE


Q: Use the graph below to answer the questions that follow: Scores on a basic Math Test 1 40 50 60 70…
A: A graph is given showing the relationship between students and their scores obtained on a basic math…
Q: The red blood cell count of a healthy person was measured on each of15 days.
A: a).The histogram is an appropriate graph to visualise one quantitative variable.Step-by-step…
Q: MONEY EARNED 13. The graph below shows the relationship between the number of hours Cody works and…
A: The graph represents the relationship between the number of hours cody works and the amount of money…
Q: 2. Which graph correctly models the relationship y= 3 A. Distance Traveled Distance Traveled 20 15…
A:
Q: When visiting his parents, Tyler drives at an average speed of 42 km/h through urban areas and at an…
A:
Q: A manager took the average age of customers who showed at a store a certain number of days per…
A: Option A- is incorrect because the graph is both increasing and decreasing. It cannot be said…
Q: What is the independent variable in the graph? 100 90 80 70 60 50 40 30.- 20 10 4. 10 12 Time spent…
A: Graph is given between time spent studying and exam score
Q: 2. The temperature in a house drops 2° for every hour the air conditioner is on between the hours of…
A: Given that there is a temperature drop of 2° every hour and at the start i.e at 6 A.M the…
Q: Two rental car companies have different charges. Company A is shown in the graph below and Company B…
A: Find the equation for charge of company A such that y-axis represents the rental cost and x-axis…
Q: Which statements are true about the graph below? (Answer all that apply) .:. 0 2 4 6 8 10 12 14 16…
A: From the graph it is clear that the tail of the distribution is elongated to the right sided.
Q: 6. The total cost of renting a car on weekdays is represented by the graph below. Total Cost vs.…
A:
Q: 13. The graph below shows a line of best fit for data collected on the amount of time teenagers…
A: We have given the line of best fit for the data collected on the amount of time teenagers spend on…
Q: pharmaceutical companies and their research programs. 12 14 16 18 1.6 1.5 1.7 14 10 07 Complete…
A: “Since you have posted a question with multiple sub-parts, we will solve the first three sub-parts…
Q: Ball pens cost $10.99 a piece. What graph shows the relationship between the humber of pens…
A:
Q: This graph shows the amount of time some students spent studying for a test, and their test results.…
A: From the given graph it can be found that most of the students who studied 5 hours achieve higher…
Q: QUE STION 16 What type of graph is depicted below? 12 10 8. 4 2. 0. 20 30 40 50 Y.
A:
Q: Two rental car companies charge different amounts. Company G is shown in the graph below. Company H…
A: Solution : Given two rental car companies charge different amounts . Company Gis shown in the…
Q: A rock is caught in the tire of a bicycle. The height of the rock is represented by the following…
A: Find the time for which the rock was stuck in the tire. The given graph is
Q: Brendan and his family are going to rent bicycles while they are on vacation. The costs to rent…
A: Given Two companies for Bike rentals and
Q: 1000 900 800 700 8 600 500 400 300 200 100 200 400 600 800 1000 Q= quantity Graph#2 Pa price
A: Given : we have to tell the units that are demanded when the price is $500. here we will first…
Q: 51. The graph and table below show infor Landscaping Company A Landscaping Company B y Time Spent…
A: We will solve the following.
Q: The graph of an equation drawn through which two points would best represent the relationship…
A: The option (60, 25) and (240, 150) is not the best fit because if we draw the line that meet the…
Q: The coach of a track team surveyed the team members on how long they slept the night before a race.…
A: In the given question there are two graphs a scatterplot and a histogram. A scatter plot has "number…
Q: 1. Write an equation that models the graph below Escribe una ecuación que modela el gráfico abajo.…
A: Find the equation of graph
Q: Question 4 Cities build bike trails and playgrounds as recreational activities. The graph shows the…
A:
Q: Alice traveled 30 miles in 3 hours. What graph shows the relationship between time traveled in hours…
A: Using graph
Q: Give conclusions that can be drawn from the graph. Select all the conclusions that can be drawn from…
A: Given: A pie chart that shows how other drivers Irk Us.
Q: This graph shows how the total cost of a members-only speaker series is related to the number of…
A:
Q: 2 What kind of graph this Per 1,000 People 700 600 s0 400 300 200 100 1960 1965 1970 1975 1980 1985…
A: A double line graph is a line graph with two lines
Q: $1.60 $3.20 $3.90 $4.80 $6.80 Average Price of a Big Mac a. The type of graph displayed is called a…
A: Given that Note: According to bartleby experts question answers guidelines an expert can solve…
Q: 1. The graph shows the data for the time it takes Jerome to bike to school, based on his average…
A: Option B is correct As the average speed increases the time he takes to get the school decreases…
Q: 3) Line graph of a bike ride 25 20 15 10 10 15 20 25 Minutes For the graph of the bike ride given,…
A: Since we only answer up to 3 sub-parts, we’ll answer the first 3. Please resubmit the question and…
Q: 2.4 In a survey, 40 people were asked how many times per year they had their car in the shop for…
A: We have given data, Number of times in shop(X) Frequency(Y) 0…
Q: ) What percentage of trips were under 25 km? ii) What percentage of trips were 22 km or more? iv)…
A: 24 19 21 27 20 17 17 32 22 26 18 13 23 30 10 13 18 22 34 16 18 23 15 19 28 25 25 20 17 15 10…
Q: use a graphng utility to the line of best fit for th below data x 2 4 4 6 8…
A:
Q: During a snowstorm, snow fell at a constant rate for a number of hours. Then it stopped snowing for…
A: Given that the graph as follows, We have to find after how many hours were there are 7 inches of…
Q: URopN4YwnAM-fIPV2X9hPeXZqSys?1oBw7QYjlbavbSPXbx-YCjsh_7mMmrq Week 3 Quiz Question 9 of 10 (1 point)|…
A: A logical operator on mathematical statements is a word or combination of words that combines one or…
Q: Plot the appropriate Graph. Here, objective is to show the linear relationship between the sales of…
A: Provided data is ; Sales(y) Amount spent in advertisement(x) 260.3 5 286.1 7 279.4 6…
Q: An object is traveling at a constant speed. The distance and time data are shown on the given graph…
A: Given query is to find the values of velocity.
Q: 20 18 Is the graph proportional or nonproportional? 10 16 14 12 Write an equation in the form y = mx…
A:
Q: Here is a graph that shows the price of blueberries at two different stores. 40 30 44.5, 2가- 20 (3,…
A: The given graph is :
Q: The graph shows the price for a package of apples at various stores in a city. The package price is…
A: The solution is given below-
Q: 2. The table below shows the number of pounds of each snack food eaten during the during NBA Finals.…
A: Given table showing the number of pounds of snacks eaten is:
Q: This graph shows how much Anthony earns babysitting, compared with the number of hours he works.…
A: We have to find the correct relation
Q: The graph below represents the relationship between Shufrah's distance from home as she walks home…
A: Consider the graph as the map such that the line segments a, b, c represents the roads or streets.…
Q: A parking garage bases its prices on the number of hours that a vehicle parks in the garage. 14 13…
A: Here we will find the pricing scheme ,
Q: Give conclusions that can be drawn from the graph. Select all the conclusions that can be drawn from…
A: From the pie chart, we see that 23% is the highest portion. That occurs for tailgating. Total…
Q: The graph of æ is the solid black graph below. Which function represents the dotted graph? 10 6 10 9…
A: From red graph, we get the points (3,5) and (8,6)
Q: The table shows the cost of hiring a plumber for the first 3 hours of a job. Time (hours) Cost…
A: Given Time and cost relation While Time is on x axis And cost Is on y axis. Check the options


Trending now
This is a popular solution!

Step by step
Solved in 2 steps with 2 images


- a) A C-chart is to be constructed for the count of surface defects in 2000 square meters of 40-kg Kraft paper. If 55 lots had a total of 550 defects. Determine the trial central line and control limits.b) An (np) chart is to be established on a painting process that is in statistical control. If 60 pieces are to be inspected every 3 hours and the fraction non-conforming is 0.06, determine the central line and control limitsWilliam Profit is studying companies going public for the first time. He isparticularly interested in the relationship between the size of the offering and theprice per share. A sample of 15 companies that recently went public revealed the following information: y x 10.8 9 11.3 94.4 11.2 27.3 11.1 179.2 11.1 71.9 11.2 97.9 11 93.5 10.7 70 11.3 160.7 10.6 96.5 10.5 83 10.3 23.5 10.7 58.7 11 93.8 10.8 34.4A process manufactures plastic tapes in batches of 50 units (tapes). The inspection records of the last 30 batches produced during one week individually by 30 workers of this process revealed the following results: (IMAGE) The production supervisor, will award a prize to the most outstanding worker of the week and in addition a party will be given in his honor. a) Draw a graph of worker vs. % of non-conforming product. b) What is the average quality level of the week obtained by the workers in this process? c) To whom should the award be assigned?Who was the best worker? Who was the worst worker? d) What would you do to improve the results of this process?
- The authors of a paper compared two different methods for measuring body fat percentage. One method uses ultrasound, and the other method uses X-ray technology. Body fat percentages using each of these methods for 16 athletes (a subset of the data given in a graph that appeared in the paper) are given in the accompanying table. You can assume that the 16 athletes who participated in this study are representative of the population of athletes. Athlete X-ray Ultrasound 1 5.00 4.25 2 16.00 12.75 3 9.25 9.00 4 12.00 11.75 5 17.25 17.00 6 29.50 27.50 7 5.50 6.50 8 6.00 6.75 9 8.00 8.75 10 9.50 10.50 11 9.25 9.50 12 11.00 12.00 13 12.00 12.25 14 14.00 15.50 15 17.00 18.00 16 18.00 18.25 Use these data to estimate the difference in mean body fat percentage measurement for the two methods. Use a confidence level of 95%. (Use ?d = ?X-ray − ?ultrasound. Round your answers to three decimal places.) , % Interpret the interval in context.…The authors of a paper compared two different methods for measuring body fat percentage. One method uses ultrasound, and the other method uses X-ray technology. Body fat percentages using each of these methods for 16 athletes (a subset of the data given in a graph that appeared in the paper) are given in the accompanying table. You can assume that the 16 athletes who participated in this study are representative of the population of athletes. Athlete X-ray Ultrasound 1 5.00 4.50 2 15.00 11.75 3 9.25 9.00 4 12.00 11.75 5 17.25 17.00 6 29.50 27.50 7 5.50 6.50 8 6.00 6.75 9 8.00 8.75 10 16.50 17.50 11 9.25 9.50 12 11.00 12.00 13 12.00 12.25 14 14.00 15.50 15 17.00 18.00 16 18.00 18.25 Use these data to estimate the difference in mean body fat percentage measurement for the two methods. Use a confidence level of 95%. (Use ?d = ?X-ray − ?ultrasound. Round your answers to three decimal places.) , % Interpret the interval in…The authors of a paper compared two different methods for measuring body fat percentage. One method uses ultrasound, and the other method uses X-ray technology. Body fat percentages using each of these methods for 16 athletes (a subset of the data given in a graph that appeared in the paper) are given in the accompanying table. You can assume that the 16 athletes who participated in this study are representative of the population of athletes. Athlete X-ray Ultrasound 1 5.00 4.25 2 12.00 8.75 3 9.25 9.00 4 12.00 11.75 5 17.25 17.00 6 29.50 27.50 7 5.50 6.50 8 6.00 6.75 9 8.00 8.75 10 9.50 10.50 11 9.25 9.50 12 11.00 12.00 13 12.00 12.25 14 14.00 15.50 15 17.00 18.00 16 18.00 18.25 Use these data to estimate the difference in mean body fat percentage measurement for the two methods. Use a confidence level of 95%. (Use ?d = ?X-ray − ?ultrasound. Round your answers to three decimal places.) , % Interpret the interval in…
- Suppose the customers arrive at a Poisson rate of on eper every 12 minutes, and that the service time is exponential at a rate of one service per 8 minutes. What are the average number of customers in the system(L) and the average time a customer spends in the system(W)? Now suppose that the arrival rate increases 20 percent.What is the corresponding change in L and W?Suppose the customers arrive at a Poisson rate of on eper every 12 minutes, and that the service time is exponential at a rate of one service per 8 minutes. What are the average number of customers in the system(L) and the average time a customer spends in the system(W)?The Admission director for a college far from mart and town believes that an inverse relationship exists between a private college's average discount rate(determined by the average amount of scholarships students receive) and the annual yield (the percentage of admitted students who actually attend). The Director's independent variable is a private college's discount rate measured as a percentage, and the dependent variable is the college's annual yield measured as a percentage. The following results were obtained for a sample of 30 private colleges: x- Discount rate(percentage) - range: 35 to 72 percent y- Annual Yield(percentage) - range: 12 o 81 percent Σxi = 1612 Σyi = 898 Σxiyi = 44,377 Σxi2 = 89,790 Σyi2 = 35,704 a. Calculate the sample regression line's slope estimate. Interpret the sample regression line's slope estimate. b. Calculate the sample regression line's intercept estimate. Interpret the sample regression line's intercept estimate. Assume the following sum of…
- Suppose 24% of students at Florida University are business students. Of those, 28% are Econ majors.What percent of Florida University students are Econ majors? Round your answer to three decimal places.A) What is the purpose of the “callout bubble” in the bottom right-hand corner of the graph, showing a tiny red square inside the yellow square? Why do you suppose the author felt the need to use a callout bubble? B) Data from this source show that the rate of symptomatic infection with COVID for people who have been vaccinated is about 100 infections per 102,000 vaccinations. As of July 30, 2021, data show that164,000,000 Americans have been fully vaccinated. How many of these vaccinated Americans would be expected to become infected with COVID and display symptoms? C) Data from this source show that the rate of death from COVID for people who have been vaccinated is about 1 death per 102,000 vaccinations. As of July 30, 2021, data show that 164,000,000 Americans have been fully vaccinated. How many of these vaccinated Americans would be expected to die from COVID?The diagram below illustrates the electricity generation in ten countries during 2011. (a) Based on the data in the graph, identify one of the fuel sources that in 2011 was intermediate in contribution among the ten countries in the amount of electricity generated. (b) Based on the data in the graph, identify the country that produced a higher percentage of its electricity in 2011 from nonhydroelectric renewables than any other country. (c) Based on the data in the graph, describe one environmental problem in South Korea that could result if its total electricity generation was increased by 10 percent with its most-used fuel source. (d) Based on the data in the graph, propose a solution to reduce an environmental problem linked to the primary means of electricity generation in Brazil, other than reduced use of that resource. (e) The ecological footprint of an average individual living in Canada is seven times larger than the ecological footprint of an average individual living in…