7. Paradox of thrift Consider a hypothetical closed economy in which there are no income taxes. If households spend $0.75 of each additional dollar they earn and save the remainder, the expenditure multiplier for this economy is The following graph shows the initial aggregate demand (AD) and short-run aggregate supply (SRAS) curves of this economy. Suppose that the economy is currently in a recession. Business firms are pessimistic about the future and do not respond to a fall in interest rates. In addition, all households are pessimistic about job prospects and desire to consume less and save more at all levels of income. As a result, personal consumption in this economy decreases by $1 billion. The reduction in personal consumption will lead to a decrease in aggregate demand by $ billion. Shift either the AD curve or the SRAS curve, or both, to show the new aggregate demand curve after the full impact of the multiplier process of the reduction in personal consumption has taken place.
7. Paradox of thrift Consider a hypothetical closed economy in which there are no income taxes. If households spend $0.75 of each additional dollar they earn and save the remainder, the expenditure multiplier for this economy is The following graph shows the initial aggregate demand (AD) and short-run aggregate supply (SRAS) curves of this economy. Suppose that the economy is currently in a recession. Business firms are pessimistic about the future and do not respond to a fall in interest rates. In addition, all households are pessimistic about job prospects and desire to consume less and save more at all levels of income. As a result, personal consumption in this economy decreases by $1 billion. The reduction in personal consumption will lead to a decrease in aggregate demand by $ billion. Shift either the AD curve or the SRAS curve, or both, to show the new aggregate demand curve after the full impact of the multiplier process of the reduction in personal consumption has taken place.

Brief Principles of Macroeconomics (MindTap Course List)
8th Edition
ISBN:9781337091985
Author:N. Gregory Mankiw
Publisher:N. Gregory Mankiw
Chapter16: The Influence Of Monetary And Fiscal Policy On Aggregate Demand
Section: Chapter Questions
Problem 8PA

Related questions
Question
1st drop down = increase/decrease
2nd drop down = increases/remains unchanged/decreases
Transcribed Image Text:PRICE LEVEL (Billions of dollars)
100
90
80
70
60
50
40
30
20
10
0
0 1
2
3 4
5
7
REAL GDP (Index numbers)
True
6
False
SRAS
AD
8
9 10
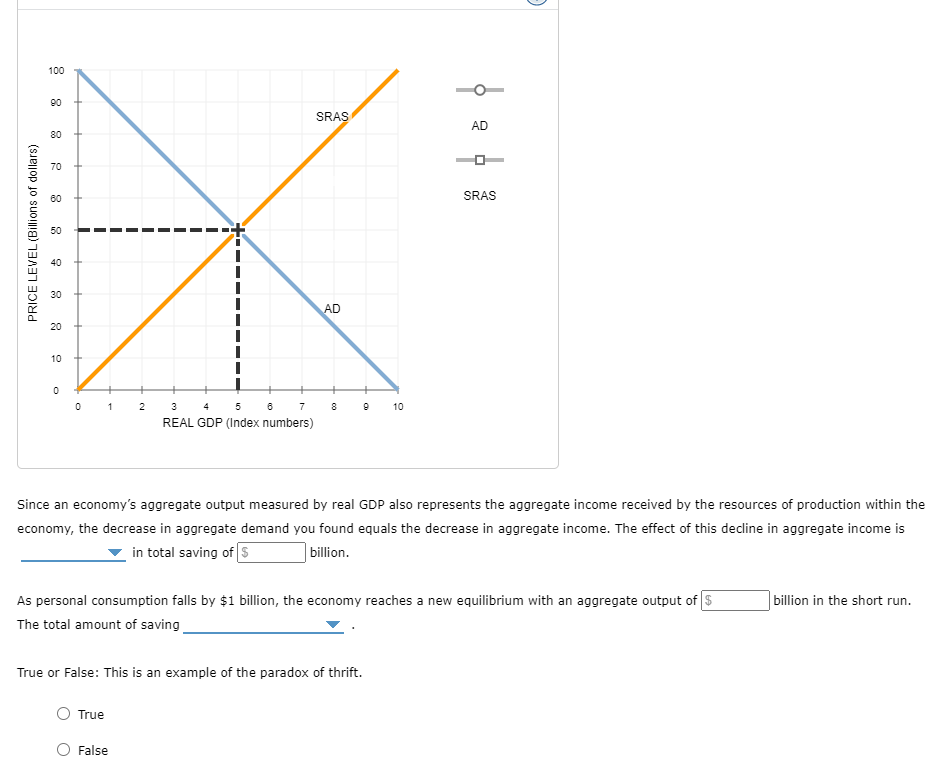
Since an economy's aggregate output measured by real GDP also represents the aggregate income received by the resources of production within the
economy, the decrease in aggregate demand you found equals the decrease in aggregate income. The effect of this decline in aggregate income is
in total saving of $
billion.
True or False: This is an example of the paradox of thrift.
AD
As personal consumption falls by $1 billion, the economy reaches a new equilibrium with an aggregate output of $
The total amount of saving
SRAS
billion in the short run.
Transcribed Image Text:7. Paradox of thrift
Consider a hypothetical closed economy in which there are no income taxes. If households spend $0.75 of each additional dollar they earn and save
the remainder, the expenditure multiplier for this economy is
The following graph shows the initial aggregate demand (AD) and short-run aggregate supply (SRAS) curves of this economy.
Suppose that the economy is currently in a recession. Business firms are pessimistic about the future and do not respond to a fall in interest rates. In
addition, all households are pessimistic about job prospects and desire to consume less and save more at all levels of income. As a result, personal
consumption in this economy decreases by $1 billion.
The reduction in personal consumption will lead to a decrease in aggregate demand by $
billion.
Shift either the AD curve or the SRAS curve, or both, to show the new aggregate demand curve after the full impact of the multiplier process of the
reduction in personal consumption has taken place.
Expert Solution
This question has been solved!
Explore an expertly crafted, step-by-step solution for a thorough understanding of key concepts.

Step by step
Solved in 4 steps with 4 images

Knowledge Booster


Learn more about
Need a deep-dive on the concept behind this application? Look no further. Learn more about this topic, economics and related others by exploring similar questions and additional content below.Recommended textbooks for you
Brief Principles of Macroeconomics (MindTap Cours…
Economics
ISBN:
9781337091985
Author:
N. Gregory Mankiw
Publisher:
Cengage Learning

Essentials of Economics (MindTap Course List)
Economics
ISBN:
9781337091992
Author:
N. Gregory Mankiw
Publisher:
Cengage Learning

Brief Principles of Macroeconomics (MindTap Cours…
Economics
ISBN:
9781337091985
Author:
N. Gregory Mankiw
Publisher:
Cengage Learning
Essentials of Economics (MindTap Course List)
Economics
ISBN:
9781337091992
Author:
N. Gregory Mankiw
Publisher:
Cengage Learning