7. The equation of the regression line is given by A. y = −116.01 + 0.12x B. y = 1321.32 − 7.64x C. y = 116.01 + 0.12x D. y = 7.64x + 1321.32


Q: The table below shows the number of state-registered automatic weapons and the murder rate for…
A: x y xy x2 11.3 13.8 155.94 127.69 8.4 11 92.4 70.56 7.2 10.4 74.88 51.84 3.9 7.3…
Q: 25 Find of the means of the variables X and Y and correlation coefficient given the following…
A:
Q: If the equation of the regression line that relates hours per week spent in the tutor lab, x, to…
A:
Q: The number of murders and robberies per 100,000 population for a random selection of states are…
A: x y xy x2 2.4 25.3 60.72 5.76 2.7 14.3 38.61 7.29 5.6 151.6 848.96 31.36 2.6 91.1…
Q: When would the B ^ estimater be the same for both the simple regression Model and the Multiple…
A: Introduction: Denote the "B ^" or the beta_hat estimator as b.
Q: The correlation coefficient between the variables x and y is r=0-60. If og=1·50, oy=2.00, E=10 and…
A: Given,r=0.60σx=1.50 , σy=2.00 ,x¯=10 , y¯=20
Q: A set of n=15 pairs of scores (X and Y values) has a SSX = 15 and SP = -60. If the mean for the X…
A:
Q: Suppose that you run a correlation and find the correlation coefficient is -0.436 and the regression…
A: Here you're given the correlation coefficient (r) is -0.436 and the regression equation is y⏞ = -…
Q: A sports statistician was interested in the relationship between game attendance (in thousands) and…
A: GivenRegression equation (y^)=4.9 x +15.2
Q: Example 2. If the relationship between two variables x and u is u + 3x = 10 and between two other…
A:
Q: 5.In a multiple regression analysis involving 15 independent variables and 200 observations, SST=800…
A: Correct answer is (B) 0.3
Q: The table below shows the numbers of new-vehicle sales for company 1 and company 2 for 11 years.…
A: The question is about regression model Given :
Q: 10 - In a study, the simple linear regression equation was found as y = - 2.65 + 3.23 * x.…
A: Given simple linear regression equation: Y = - 2.65 + 3.23 * x
Q: y' when x=3, if the equation of the regression line is y=23.1 - 3.8x
A: Given that Regression line y=23.1 - 3.8x x=3 We know general regression line Y= A+B*X Here, X=…
Q: 30 - In one study, the simple linear regression equation was found to be y = - 2.65 + 3.23 * x.…
A: A fitted linear regression model of y on x is given by,
Q: What is the equation for the regression line if n = 7,x = 69, y= 528, ay = 4754and z² = 825? ý =…
A:
Q: In a regression model involving 30 observations, the following estimated regression equation was…
A: Given SSR = 1,740 SST = 2,000. N=number of observation=30, K=Number of explanatory variables…
Q: Since the simple linear regression equation between X and Y variables is Y=4+6X, what is X if Y=45?…
A: Given equation is,Y=4+6Xand Y=45
Q: If the regression equation is equal to Y=23.6−54.2X, then 23.6 is the _____ while -54.2 is the ____…
A: The general form of the regression equation is, y=a+bx Where a be the intercept and b be the slope.…
Q: Suppose that you run a correlation and find the correlation coefficient is -0.762 and the regression…
A: From the given information, y^=-4.3x+47.72 Given x=6.9
Q: The number of initial public offerings of stock issued in a 10-year period and the total proceeds of…
A: Given Information:
Q: Regression analysis was applied between sales data (y in $1000s) and advertising data (x in $100s)…
A: The given regression equation is = 12 + 1.8x n = 17 SSR = 225 SSE = 75 sb1 = .2683
Q: Suppose the equation of the regression line for the number of emails a person recieves at a…
A: The given linear equation is y = 13 + 16x.
Q: Interpret the regression coefficient of X3 in relation to the Y ( X3 unit is mile) Y = 58.286 +…
A: The regression coefficient of X3 is given by 13.7604
Q: Which of the following represents a regression line. a. y = 12.82x (0.24x - 2.56) b. y = -0.57x -…
A: In regression a variable is predicted using other variables. Simple linear regression implies there…
Q: suppose that the regression line is ŷ= 2(x-4), then the predicted value of y when x= 5 is O -4 O 2 O…
A: Given Regression equation is y=2(x-4) If x=5 y=?
Q: 17. Suppose the regression line for the relationship between rainfall and hot dog sales can be…
A: Answer Option 4 th 3316 is correct
Q: The grades of a sample of 9 students on a prelim exam (x) and on the midterm exam (y) are shown…
A: Calculate Fitting a straight line - Curve fitting using Least square method X Y 96 99 81 47…
Q: Given are five observations for two variables, x and y. xi -3 12 6 20 14 yi -55 40 55 10 15 Develop…
A: Given that
Q: A set of n = 50 pairs of X and Y scores has SSX = 39.73, SSY = 23.48, and SP = 42.91. What is the…
A: Given that n=50
Q: The table below shows the number of state-registered automatic weapons and the murder rate for…
A: In this case thousands of automatic weapons (x) is the independent variable and murders per 100,000…
Q: set of X and Y scores has SSx=10,Ssy=20,and SP =8,what is the b in the regression equation?
A:
Q: The equation of the regression line that relates hours per week spent in the tutor lab, xx, to GPA,…
A: (a) Obtain the best prediction for the GPA of students who never go to the tutor lab. From the…
Q: The correlation coefficient between two variables X and Y is r= 0.6. If Sx = 1.50, Sy = 2, X = 10…
A:
Q: = 130 − 20x Based on the above estimated regression equation, if price is increased by 5 units, then…
A: Given : regression equation : ŷ = 130 − 20x
Q: Part A, B, and C
A: The provided information are:
Q: 2 2 - F40) x y 23 ; 88 76 ; 300 27 ; 105 64 ; 240 15 ; 60 51 ; 205 33 ; 120 29 ; 110…
A: Introduction - Formula for linear regression equation is given by y=a+bx…
Q: A researcher wants to study the factors affecting a person's decision to buy a car. For his study,…
A:
Q: Use the following table to find the equation of the regression line, between x and y 2 3 4 1 3 y 1 2…
A: Given data, X Y X*Y X*X 2 1 2 4 3 0 0 9 4 2 8 16 1 3 3 1 2 3 6 4 3 2 6 9
Q: . The number of murders and robberies per 100,000 population for a random selection of states are…
A:
Q: True or false? If the statement is false, use one or two sentences to justify your answer.
A: The slope of the regression equation can be obtained as; Slope = SP/SSx = 20/36 = 0.55. Hence, the…
Q: create a line in DESMOS with the linear regression equation: y1 ~ mx1 + b 2) create a second line…
A: Here the given table is Time 0 20 40 60 80 100 120 140 160 180 200 220 Water level 42.6…
Q: 11. Define the correlation coefficient ry between the variables x, y. will be positive or negative…
A:
Q: A professor wants to investigate the relationship between the grades students obtain in their…
A: ∑(xi-x)2ui2 = 410.25∑(xi-x)2 =230.48n = 60
Q: A professor decides to investigate the relationship between midterm exam score and final exam score…
A: Given r2=0.74
Q: Suppose that you run a correlation and find the correlation coefficient is 0.338 and the regression…
A: Given regression line Y^=-12.7+4.3*X We want to predict the value at X=4.4
Q: 2 2 (b) Find the equation of the regression line. (Round the values to two decimal places.) in
A: Using excel, data has been plotted
Q: In a study, the simple linear regression equation was found as y = - 2.65 + 3.23 * x. Accordingly,…
A:
Q: In a regression model involving 45 observations, the following estimated regression equation was…
A: Provided infroamtion is, a regression model involving 45 observations. Estimated regresson equation…
Q: Suppose that you run a correlation and find the correlation coefficient is -0.256 and the regression…
A: Given regression equation ŷ = -5.8x + 56.92
7. The equation of the regression line is given by
A. y = −116.01 + 0.12x
B. y = 1321.32 − 7.64x
C. y = 116.01 + 0.12x
D. y = 7.64x + 1321.32


Trending now
This is a popular solution!

Step by step
Solved in 2 steps with 3 images

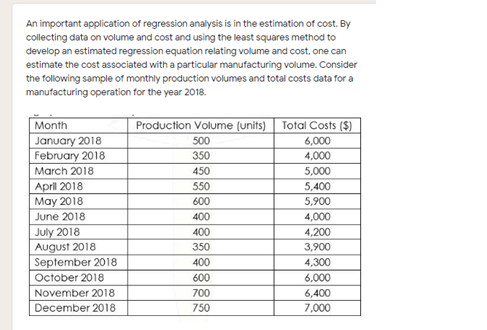
- What is regression analysis? Describe the process of performing regression analysis on a graphing utility.An important application of regression analysis in accounting is in the estimation of cost. By collecting data on volume and cost and using the least squares method to develop an estimated regression equation relating volume and cost, an accountant can estimate the cost associated with a particular manufacturing volume. Consider the following sample of production volumes and total cost data for a manufacturing operation.An important application of regression analysis is in the estimation of cost. By collecting data on volume and cost and using the least squares method to develop an estimated regression equation relating volume and cost, one can estimate the cost associated with a particular manufacturing volume. Consider the following sample of monthly production volumes and total costs data for a manufacturing operation for the year 2018. Month (2018) Volume of Production (Units) Total Costs ($) Jan 500 6000 Feb 350 4000 Mar 450 5000 Apr 550 5400 May 600 5900 Jun 400 4000 Jul 400 4200 Aug 350 3900 Sept 400 4300 Oct 600 6000 Nov 700 6400 Dec 750 7000 1) Calculate the (Pearson) correlation coefficient between production volume and total costs in this problem. 2) What is the most suitable interpretation of the (Pearson) correlation coefficient between production volume and total costs in this problem? 3) The equation of the regression line is given by...? 4) How…
- An important application of regression analysis is in the estimation of cost. By collecting data on volume and cost and using the least squares method to develop an estimated regression equation relating volume and cost, one can estimate the cost associated with a particular manufacturing volume. Consider the following sample of monthly production volumes and total costs data for a manufacturing operation for the year 2018. Month (2018) Volume of Production (Units) Total Costs ($) Jan 500 6000 Feb 350 4000 Mar 450 5000 Apr 550 5400 May 600 5900 Jun 400 4000 Jul 400 4200 Aug 350 3900 Sept 400 4300 Oct 600 6000 Nov 700 6400 Dec 750 7000 1) Which of the following is NOT necessarily true about the interpretation of the value of b in the simple linear regression equation y = a + bx for this problem? 2) Which of the following statements are true about the dependent (or response) and independent (or predictor) variables for the simple linear model in…An important application of regression analysis in accounting is in the estimation of cost. By collecting data on volume and cost and using the least squares method to develop an estimated regression equation relating volume and cost, an accountant can estimate the cost associated with a particular manufacturing volume. Consider the following sample of production volumes and total cost data for a manufacturing operation. KINDLY ANSWER LETTER DCost Estimation. An important application of regression analysis in accounting is in the estimation of cost. By collecting data on volume and cost and using the least squares method to develop an estimated regression equation relating volume and cost, an accountant can estimate the cost associated with a particular manufacturing volume. Consider the following sample of production volumes and total cost data for a manufacturing operation. Production Volume (units) Total Cost ($) 400 4000 450 5000 550 5400 600 5900 700 6400 750 7000 Regression equation y=1246.667 + 7.6x Variable cost per unit produced = 7.6 Compute the coefficient of determination. = 0.9587 Question 1 - What percentage of the variation in total cost can be explained by production volume?Question 2 - The company’s production schedule shows 500 units must be produced next month. Predict the total cost for this operation. Please do not…
- An important application of regression analysis is in the estimation of cost. By collecting data on volume and cost and using the least-squares method to develop an estimated regression equation relating volume and cost, one can estimate the cost associated with a particular manufacturing volume. Consider the following sample of monthly production volumes and total costs data for a manufacturing operation for the year 2018 (Please help me.. this problem is the only chance my teacher gave me to pass our math subject... thank you very much in advance) 1. Which of the following is NOT necessarily true about the interpretation of the value of b in the simple linear regression equation y = a + bx for this problem? I.The monthly total costs will increase by Rs 7.637 for every one-unit increase in the production volume. II.Since b>0, there is a direct relationship between production volume and total costs. III. Because b>1, there is a very strong positive linear relationship between…In a study of housing demand, the county assessor develops the following regression model to estimate the market value (i.e., selling price) of residential property within his jurisdiction. The assessor suspects that important variables affecting selling price (YY, measured in thousands of dollars) are the size of a house (X1X1, measured in hundreds of square feet), the total number of rooms (X2X2), age (X3X3), and whether or not the house has an attached garage (X4X4, No=0, Yes=1No=0, Yes=1). Y=α+β1X1+β2X2+β3X3+β4X4+εY=α+β1X1+β2X2+β3X3+β4X4+ε Now suppose that the estimate of the model produces following results: a=166.048a=166.048, b1=3.459b1=3.459, b2=8.015b2=8.015, b3=−0.319b3=−0.319, b4=1.186b4=1.186, sb1=1.079sb1=1.079, sb2=5.288sb2=5.288, sb3=0.789sb3=0.789, sb4=12.252sb4=12.252, R2=0.838R2=0.838, F-statistic=12.919F-statistic=12.919, and se=13.702se=13.702. Note that the sample consists of 15 randomly selected observations. According to the estimated model, holding all…An important application of regression analysis in accounting is in the estimation of cost. By collecting data on volume and cost and using the least squares method to develop an estimated regression equation relating volume and cost, an accountant can estimate the cost associated with a particular manufacturing volume. Consider the following sample of production volumes and total cost data for a manufacturing operation. Production Volume (Units) Total Cost ($) 400 4000 450 5000 550 5400 600 5900 700 6400 750 7000 Use these data to develop an estimated regression Equation that could be used to predict the total cost for a given production volume. What is the variable Cost per unit produced? Compute the coefficient of determination. What percentage of the variation in total cost can be explained by production volume? The company's production schedule shows 500 untis must be produced next month. Predict the total cost for this operation. Where data on production…
- An important application of regression analysis in accounting is in the estimation of cost. By collecting data on volume and cost and using the least squares method to develop an estimated regression equation relating volume and cost, an accountant can estimate the cost associated with a particular manufacturing volume. Consider the following sample of production volumes and total cost data for a manufacturing operation. Production Volume (Units) Total Cost ($) 400 4000 450 5000 550 5400 600 5900 700 6400 750 7000 Use these data to develop an estimated regression Equation that could be used to predict the total cost for a given production volume. What…An important application of regression analysis in accounting is in the estimation of cost. By collecting data on volume and cost and using the least squares method to develop an estimated regression equation relating volume and cost, an accountant can estimate the cost associated with a particular manufacturing volume. Consider the following sample of production volumes and total cost data for a manufacturing operation. Production Volume (units) Total Cost ($) 400 4,300 450 5,300 550 5,700 600 6,200 700 6,700 750 7,300 a. Compute b1 and b0 (to 1 decimal). b. The company's production schedule shows 500 units must be produced next month. What is the estimated total cost for this operation (to the nearest whole number)?The Pilot Pen Company has decided to use 15 test markets to examine the sensitivity of demand for its new product to various prices, as shown in the following table. Advertising effort was identical in each market. Each market had approximately the same level of business activity and population.a. Using a linear regression model, estimate the demand function for Pilot’s new pen.b. Evaluate this model by computing the coefficient of determination and by performing a t-test of the significance of the price variable.c. What is the price elasticity of demand at a price of 50 cents? TEST MARKET PRICE CHARGED (¢) QUANTITY SOLD(THOUSANDS OF PENS) 1 2 3 4 5 6 7 8 9 10 11 12 13 14 15 50 50 55 55 60 60 65 65 70 70¢ 80 80 90¢ 90 40 20.0 21.0 19.0 19.5 20.5 19.0 16.0 15.0 14.5 15.5 13.0 14.0 11.5 11.0 17.0


