7. The number of defective parts per shipment has been tabulated in the following frequency distribution. Find the mean of defective parts per shipment. Frequency Number of defective parts per shipment 0.5-3.5 3.5-6.5 20 6.5-9.5 9.5-12.5 32 12.5-15.5 3. 15.5-18.5
7. The number of defective parts per shipment has been tabulated in the following frequency distribution. Find the mean of defective parts per shipment. Frequency Number of defective parts per shipment 0.5-3.5 3.5-6.5 20 6.5-9.5 9.5-12.5 32 12.5-15.5 3. 15.5-18.5

Glencoe Algebra 1, Student Edition, 9780079039897, 0079039898, 2018
18th Edition
ISBN:9780079039897
Author:Carter
Publisher:Carter
Chapter10: Statistics
Section10.4: Distributions Of Data
Problem 3GP

Related questions
Question
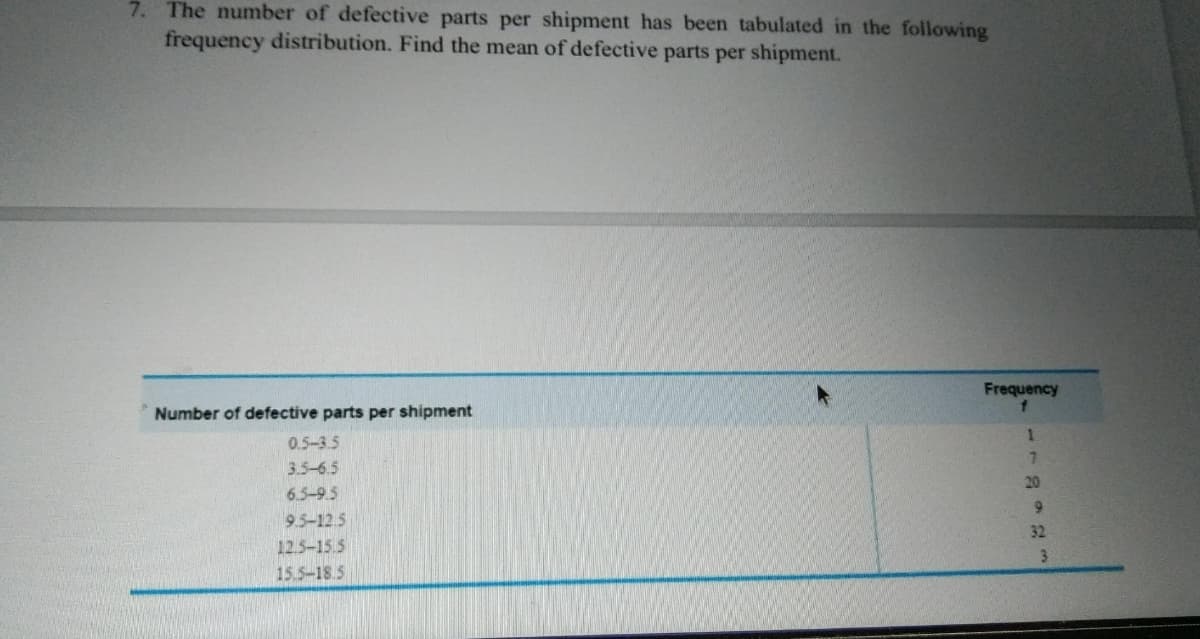
Transcribed Image Text:7. The number of defective parts per shipment has been tabulated in the following
frequency distribution. Find the mean of defective parts per shipment.
Frequency
Number of defective parts per shipment
0.5-3.5
3.5-6.5
20
6.5-9.5
9.5-12.5
32
12.5-15.5
15.5-18.5
Expert Solution
This question has been solved!
Explore an expertly crafted, step-by-step solution for a thorough understanding of key concepts.

Step by step
Solved in 2 steps with 2 images

Recommended textbooks for you
Glencoe Algebra 1, Student Edition, 9780079039897…
Algebra
ISBN:
9780079039897
Author:
Carter
Publisher:
McGraw Hill
Glencoe Algebra 1, Student Edition, 9780079039897…
Algebra
ISBN:
9780079039897
Author:
Carter
Publisher:
McGraw Hill