7. The table shows the percent of a sample of strontium-90 that remains every 5 years. 15 Year Percent Remaining 100.0 a) Using technology, determine the equation of the line or curve of best fit that best represents this data. Is it a strong correlation (R - value)? b) Use your equation to estimate how much Strontium-90 is left in year 40. 88.7 78.7 10 15 69.9 20 62.0 25 55.0 30 48.8
7. The table shows the percent of a sample of strontium-90 that remains every 5 years. 15 Year Percent Remaining 100.0 a) Using technology, determine the equation of the line or curve of best fit that best represents this data. Is it a strong correlation (R - value)? b) Use your equation to estimate how much Strontium-90 is left in year 40. 88.7 78.7 10 15 69.9 20 62.0 25 55.0 30 48.8

Glencoe Algebra 1, Student Edition, 9780079039897, 0079039898, 2018
18th Edition
ISBN:9780079039897
Author:Carter
Publisher:Carter
Chapter4: Equations Of Linear Functions
Section4.5: Correlation And Causation
Problem 24PFA

Related questions
Question
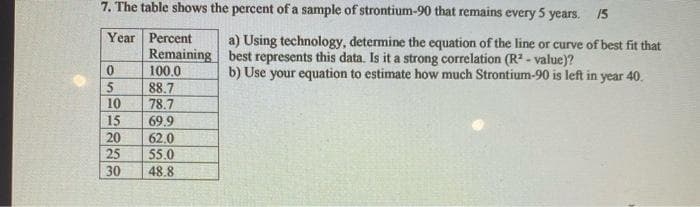
Transcribed Image Text:7. The table shows the percent of a sample of strontium-90 that remains every 5 years. 15
Year Percent
Remaining
100.0
88,7
a) Using technology, determine the equation of the line or curve of best fit that
best represents this data. Is it a strong correlation (R - value)?
b) Use your equation to estimate how much Strontium-90 is left in year 40.
10
78.7
69.9
62.0
15
20
25
55.0
48.8
30
Expert Solution
This question has been solved!
Explore an expertly crafted, step-by-step solution for a thorough understanding of key concepts.

Step by step
Solved in 3 steps with 2 images

Recommended textbooks for you
Glencoe Algebra 1, Student Edition, 9780079039897…
Algebra
ISBN:
9780079039897
Author:
Carter
Publisher:
McGraw Hill

Big Ideas Math A Bridge To Success Algebra 1: Stu…
Algebra
ISBN:
9781680331141
Author:
HOUGHTON MIFFLIN HARCOURT
Publisher:
Houghton Mifflin Harcourt
Glencoe Algebra 1, Student Edition, 9780079039897…
Algebra
ISBN:
9780079039897
Author:
Carter
Publisher:
McGraw Hill
Big Ideas Math A Bridge To Success Algebra 1: Stu…
Algebra
ISBN:
9781680331141
Author:
HOUGHTON MIFFLIN HARCOURT
Publisher:
Houghton Mifflin Harcourt