7.1 The Central Limit Theorem for Sample Means (Averages) 61. Previously, De Anza statistics students estimated that the amount of change daytime statistics students cam exponentially distributed with a mean of $0.88. Suppose that we randomly pick 25 daytime statistics students. In words, X = b. X- a. С. In words, X = d. Find the probability that an individual had between $0.80 and $1.00. Graph the situation, and shade in the area be determined. e. f. Find the probability that the average of the 25 students was between $0.80 and $1.00. Graph the situation. shade in the area to be determined. g. Explain why there is a difference in part e and part f. butod uith a mean of 250 fee
7.1 The Central Limit Theorem for Sample Means (Averages) 61. Previously, De Anza statistics students estimated that the amount of change daytime statistics students cam exponentially distributed with a mean of $0.88. Suppose that we randomly pick 25 daytime statistics students. In words, X = b. X- a. С. In words, X = d. Find the probability that an individual had between $0.80 and $1.00. Graph the situation, and shade in the area be determined. e. f. Find the probability that the average of the 25 students was between $0.80 and $1.00. Graph the situation. shade in the area to be determined. g. Explain why there is a difference in part e and part f. butod uith a mean of 250 fee

Glencoe Algebra 1, Student Edition, 9780079039897, 0079039898, 2018
18th Edition
ISBN:9780079039897
Author:Carter
Publisher:Carter
Chapter10: Statistics
Section10.4: Distributions Of Data
Problem 19PFA

Related questions
Question
How would you start these problems? I'm having difficutly knowing what formulas to use.
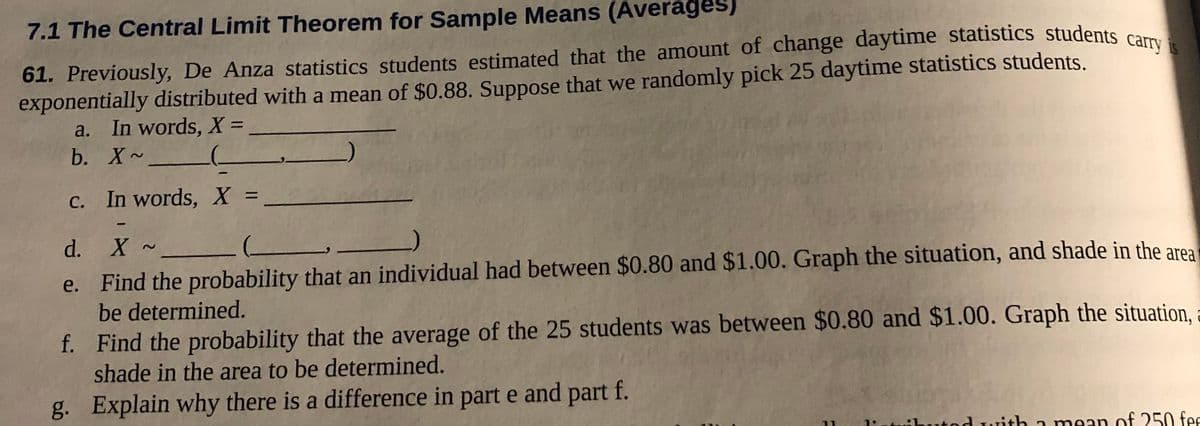
Transcribed Image Text:7.1 The Central Limit Theorem for Sample Means (Averages)
61. Previously, De Anza statistics students estimated that the amount of change daytime statistics students car
exponentially distributed with a mean of $0.88. Suppose that we randomly pick 25 daytime statistics students.
а.
In words, X =
b. X~
C. In words, X:
%3D
d.
e. Find the probability that an individual had between $0.80 and $1.00. Graph the situation, and shade in the area
be determined.
f. Find the probability that the average of the 25 students was between $0.80 and $1.00. Graph the situation,
shade in the area to be determined.
g. Explain why there is a difference in part e and part f.
ibutod with a mean of 250 fee
Expert Solution
This question has been solved!
Explore an expertly crafted, step-by-step solution for a thorough understanding of key concepts.

This is a popular solution!

Trending now
This is a popular solution!

Step by step
Solved in 2 steps with 1 images

Recommended textbooks for you
Glencoe Algebra 1, Student Edition, 9780079039897…
Algebra
ISBN:
9780079039897
Author:
Carter
Publisher:
McGraw Hill
Glencoe Algebra 1, Student Edition, 9780079039897…
Algebra
ISBN:
9780079039897
Author:
Carter
Publisher:
McGraw Hill