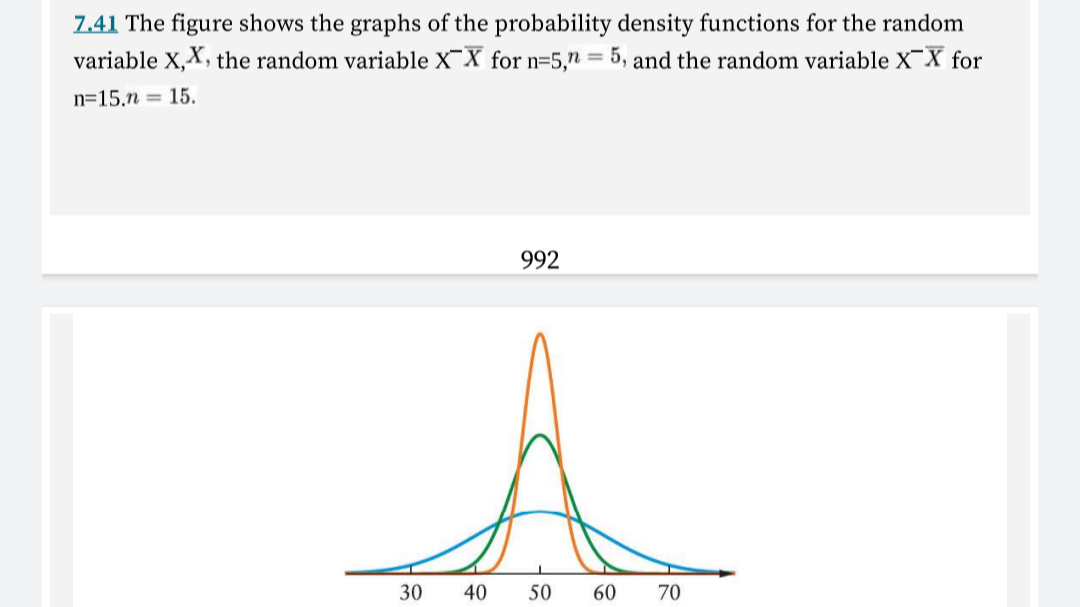
7.41 The figure shows the graphs of the probability density functions for the random variable X,X, the random variable XX for n=5," = 5, and the random variable XX for n=15,n = 15.
7.41 The figure shows the graphs of the probability density functions for the random variable X,X, the random variable XX for n=5," = 5, and the random variable XX for n=15,n = 15.

Glencoe Algebra 1, Student Edition, 9780079039897, 0079039898, 2018
18th Edition
ISBN:9780079039897
Author:Carter
Publisher:Carter
Chapter10: Statistics
Section10.1: Measures Of Center
Problem 9PPS

Related questions

Question
Answer with proper explanation.
Transcribed Image Text:7.41 The figure shows the graphs of the probability density functions for the random
variable X,X, the random variable X¯X for n=5," = 5, and the random variable X¯X for
n=15,n = 15.
992
30
40
50
60
70
Expert Solution
This question has been solved!
Explore an expertly crafted, step-by-step solution for a thorough understanding of key concepts.

Step by step
Solved in 2 steps with 1 images

Knowledge Booster


Learn more about
Need a deep-dive on the concept behind this application? Look no further. Learn more about this topic, statistics and related others by exploring similar questions and additional content below.Recommended textbooks for you
Glencoe Algebra 1, Student Edition, 9780079039897…
Algebra
ISBN:
9780079039897
Author:
Carter
Publisher:
McGraw Hill
Glencoe Algebra 1, Student Edition, 9780079039897…
Algebra
ISBN:
9780079039897
Author:
Carter
Publisher:
McGraw Hill