( 8 9 15 7 6 14 13 10.86 13.98 12.20 12.74 9.18 7.14 13.54 =+x (Round to two decimal places as needed.) Create a scatterplot of the data. Choose the correct graph below. A. Ay 25-1 20 15 104 5-3 0 5 10 15 20 25 800 5 11 12 10 4.74 13.80 14.06 13.18 Q O B. Ay 25- 20 15 10 5 0 5 10 15 20 25 dentify a characteristic of the data that is ignored by the regression line. OA. There is an influential point that strongly affects the graph of the regression line. OB. The data has a pattern that is not a straight line. OC. There is no trend in the data. OD. There is no characteristic of the data that is ignored by the regression line. Q CHE OC. 25 20 15- 104 5 0- 0 5 10 15 20 25 Q ✔ O D. Ay 25+ 20 15- 10- 5 0 5 10 15 20 25 Q Q G
( 8 9 15 7 6 14 13 10.86 13.98 12.20 12.74 9.18 7.14 13.54 =+x (Round to two decimal places as needed.) Create a scatterplot of the data. Choose the correct graph below. A. Ay 25-1 20 15 104 5-3 0 5 10 15 20 25 800 5 11 12 10 4.74 13.80 14.06 13.18 Q O B. Ay 25- 20 15 10 5 0 5 10 15 20 25 dentify a characteristic of the data that is ignored by the regression line. OA. There is an influential point that strongly affects the graph of the regression line. OB. The data has a pattern that is not a straight line. OC. There is no trend in the data. OD. There is no characteristic of the data that is ignored by the regression line. Q CHE OC. 25 20 15- 104 5 0- 0 5 10 15 20 25 Q ✔ O D. Ay 25+ 20 15- 10- 5 0 5 10 15 20 25 Q Q G

College Algebra
7th Edition
ISBN:9781305115545
Author:James Stewart, Lothar Redlin, Saleem Watson
Publisher:James Stewart, Lothar Redlin, Saleem Watson
Chapter1: Equations And Graphs
Section: Chapter Questions
Problem 10T: Olympic Pole Vault The graph in Figure 7 indicates that in recent years the winning Olympic men’s...

Related questions
Question
x y
8 10.86
13 13.98
9 12.2
15 12.74
7 9.18
6 7.14
14 13.54
5 4.74
11 13.8
12 14.06
10 13.18
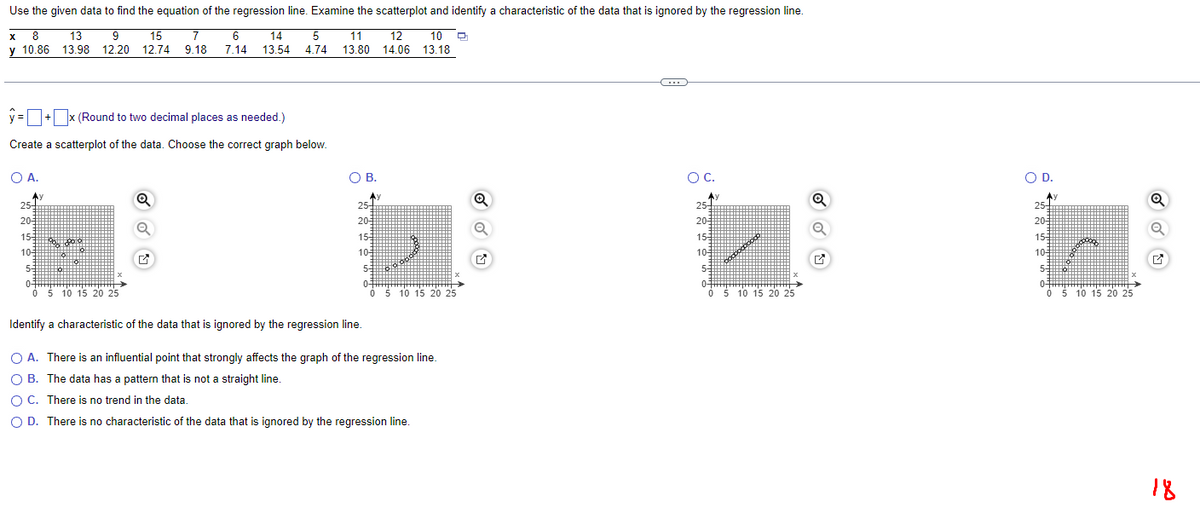
Transcribed Image Text:Use the given data to find the equation of the regression line. Examine the scatterplot and identify a characteristic of the data that is ignored by the regression line.
X 8
13
9
15
7
6
14
5 11 12 10 D
4.74 13.80 14.06 13.18
y 10.86 13.98 12.20 12.74 9.18 7.14 13.54
y=+x (Round to two decimal places as needed.)
Create a scatterplot of the data. Choose the correct graph below.
O A.
Ay
25+
20-
15-3
10-
53
0-
0 5 10 15 20 25
Q
O B.
25
20-
15:
10
y
5-
0-
0 5 10 15 20 25
Identify a characteristic of the data that is ignored by the regression line.
O A. There is an influential point that strongly affects the graph of the regression line.
O B.
The data has a pattern that is not a straight line.
O C.
There is no trend in the data.
O D. There is no characteristic of the data that is ignored by the regression line.
Q
O C.
25-
20-
153
10-
Soooooooo
53
0-
0 5 10 15 20 25
Q
O D.
25
20-
15
10-
53
07
0 5 10 15 20 25
Q
18
Expert Solution
This question has been solved!
Explore an expertly crafted, step-by-step solution for a thorough understanding of key concepts.

Step by step
Solved in 2 steps

Recommended textbooks for you
College Algebra
Algebra
ISBN:
9781305115545
Author:
James Stewart, Lothar Redlin, Saleem Watson
Publisher:
Cengage Learning

Functions and Change: A Modeling Approach to Coll…
Algebra
ISBN:
9781337111348
Author:
Bruce Crauder, Benny Evans, Alan Noell
Publisher:
Cengage Learning

Algebra and Trigonometry (MindTap Course List)
Algebra
ISBN:
9781305071742
Author:
James Stewart, Lothar Redlin, Saleem Watson
Publisher:
Cengage Learning
College Algebra
Algebra
ISBN:
9781305115545
Author:
James Stewart, Lothar Redlin, Saleem Watson
Publisher:
Cengage Learning
Functions and Change: A Modeling Approach to Coll…
Algebra
ISBN:
9781337111348
Author:
Bruce Crauder, Benny Evans, Alan Noell
Publisher:
Cengage Learning
Algebra and Trigonometry (MindTap Course List)
Algebra
ISBN:
9781305071742
Author:
James Stewart, Lothar Redlin, Saleem Watson
Publisher:
Cengage Learning