8 points) Identify the critical t. An independent reedom and the crtical random sample is selected from an approximately normal population with unknown standard deviation. Find the degrees of selected from an t value for the given sample size and confidence level. Round critical t values to 3 decimal places Sample size, n Conflidence level Degree of Freedom Critical value, 12 90 95 98 27 17
8 points) Identify the critical t. An independent reedom and the crtical random sample is selected from an approximately normal population with unknown standard deviation. Find the degrees of selected from an t value for the given sample size and confidence level. Round critical t values to 3 decimal places Sample size, n Conflidence level Degree of Freedom Critical value, 12 90 95 98 27 17

Glencoe Algebra 1, Student Edition, 9780079039897, 0079039898, 2018
18th Edition
ISBN:9780079039897
Author:Carter
Publisher:Carter
Chapter10: Statistics
Section10.3: Measures Of Spread
Problem 1GP

Related questions
Question
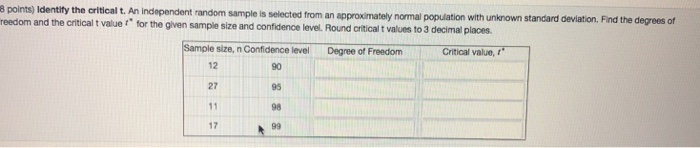
Transcribed Image Text:8 points) Identify the critical t. An independent
reedom and the crtical
random sample is selected from an approximately normal population with unknown standard deviation. Find the degrees of
selected from an
t value
for the given sample size and confidence level. Round critical t values to 3 decimal places
Sample size, n Conflidence level Degree of Freedom Critical value,
12
90
95
98
27
17
Expert Solution
This question has been solved!
Explore an expertly crafted, step-by-step solution for a thorough understanding of key concepts.

This is a popular solution!

Trending now
This is a popular solution!

Step by step
Solved in 7 steps with 5 images

Recommended textbooks for you
Glencoe Algebra 1, Student Edition, 9780079039897…
Algebra
ISBN:
9780079039897
Author:
Carter
Publisher:
McGraw Hill

College Algebra (MindTap Course List)
Algebra
ISBN:
9781305652231
Author:
R. David Gustafson, Jeff Hughes
Publisher:
Cengage Learning
Glencoe Algebra 1, Student Edition, 9780079039897…
Algebra
ISBN:
9780079039897
Author:
Carter
Publisher:
McGraw Hill
College Algebra (MindTap Course List)
Algebra
ISBN:
9781305652231
Author:
R. David Gustafson, Jeff Hughes
Publisher:
Cengage Learning