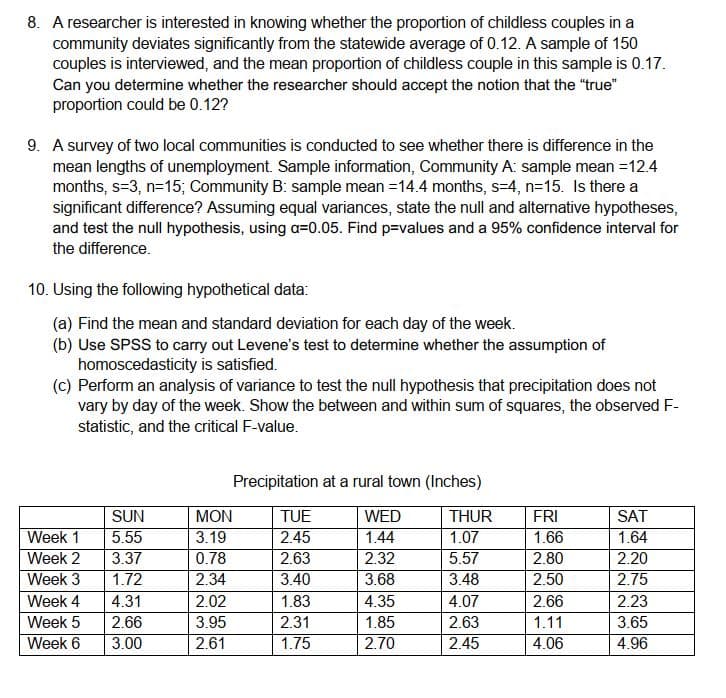
8. A researcher is interested in knowing whether the proportion of childless couples in a community deviates significantly from the statewide average of 0.12. A sample of 150 couples is interviewed, and the mean proportion of childless couple in this sample is 0.17. Can you determine whether the researcher should accept the notion that the "true" proportion could be 0.12?
8. A researcher is interested in knowing whether the proportion of childless couples in a community deviates significantly from the statewide average of 0.12. A sample of 150 couples is interviewed, and the mean proportion of childless couple in this sample is 0.17. Can you determine whether the researcher should accept the notion that the "true" proportion could be 0.12?

Glencoe Algebra 1, Student Edition, 9780079039897, 0079039898, 2018
18th Edition
ISBN:9780079039897
Author:Carter
Publisher:Carter
Chapter10: Statistics
Section10.3: Measures Of Spread
Problem 1GP

Related questions

Question
Transcribed Image Text:8. A researcher is interested in knowing whether the proportion of childless couples in a
community deviates significantly from the statewide average of 0.12. A sample of 150
couples is interviewed, and the mean proportion of childless couple in this sample is 0.17.
Can you determine whether the researcher should accept the notion that the "true"
proportion could be 0.12?
9. A survey of two local communities is conducted to see whether there is difference in the
mean lengths of unemployment. Sample information, Community A: sample mean =12.4
months, s=3, n=15; Community B: sample mean =14.4 months, s=4, n=15. Is there a
significant difference? Assuming equal variances, state the null and alternative hypotheses,
and test the null hypothesis, using a=0.05. Find p=values and a 95% confidence interval for
the difference.
10. Using the following hypothetical data:
(a) Find the mean and standard deviation for each day of the week.
(b) Use SPSS to carry out Levene's test to determine whether the assumption of
homoscedasticity is satisfied.
(c) Perform an analysis of variance to test the null hypothesis that precipitation does not
vary by day of the week. Show the between and within sum of squares, the observed F-
statistic, and the critical F-value.
Precipitation at a rural town (Inches)
SUN
MON
TUE
WED
THUR
FRI
SAT
Week 1
Week 2
Week 3
5.55
3.37
1.72
3.19
0.78
1.07
5.57
2.45
1.44
1.66
1.64
2.63
2.32
2.80
2.20
2.34
3.40
3.68
3.48
2.50
2.75
Week 4
4.31
2.02
1.83
4.35
4.07
2.66
2.23
Week 5
2.66
3.95
2.31
1.85
2.63
1.11
3.65
Week 6
3.00
2.61
2.45
4.06
4.96
Expert Solution
Step 1
Note: Since you have posted multiple independent questions in the same request, we will solve the first question for you. To get the remaining questions solved, please repost other questions independently.
Set up,

Trending now
This is a popular solution!

Step by step
Solved in 5 steps

Knowledge Booster


Learn more about
Need a deep-dive on the concept behind this application? Look no further. Learn more about this topic, statistics and related others by exploring similar questions and additional content below.Recommended textbooks for you
Glencoe Algebra 1, Student Edition, 9780079039897…
Algebra
ISBN:
9780079039897
Author:
Carter
Publisher:
McGraw Hill
Glencoe Algebra 1, Student Edition, 9780079039897…
Algebra
ISBN:
9780079039897
Author:
Carter
Publisher:
McGraw Hill