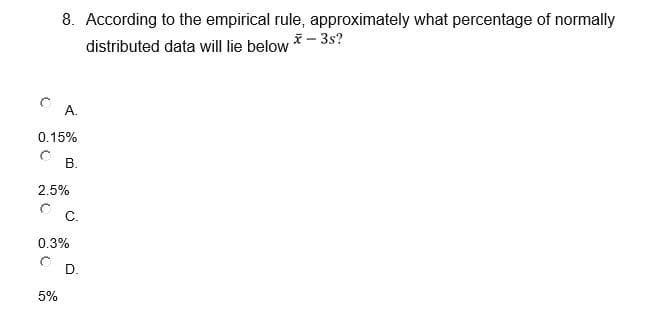
8. According to the empirical rule, approximately what percentage of normally - 3s? distributed data will lie below


Q: Describe the data using appropriate measures of central tendency and comment on the distribution of…
A: Mean (Average): Represents the sum of all values in a dataset divided by the total number of the…
Q: If the sample of parts are measured and the mean of the sample measurements is outside the control…
A: It is given that if a sample of parts are measured and then the mean of the sample falls outside the…
Q: Which measure of central tendency should be used if the data are not skewed, does not contain any…
A: Which measure of central tendency should be used if the data are not skewed, does not contain any…
Q: What two characteristics of an empirical distribution can DECREASE the size of the standard error?
A: The two characteristics of an empirical distribution that can decrease the size of the standard…
Q: data is highly skewed,
A: In case the data is highly skewed, can we still rely on the kurtosis coefficient? Why or why not?…
Q: What is the best statistical method to use when measuring two nominal level variables? Why?
A: Nominal scales are used, without any quantitative significance, to label variables. One might…
Q: Variability in a distribution that would be otherwise non-normal may tend towards normality with…
A: When the distribution is non-normal and if random sampling is used, there are chances that the…
Q: How do I interpret the 6 charcteristics of data when I am only given the mean, median, mode, and…
A: According to the provided information, mean, median, mode, and standard deviation are given.
Q: What is the acceptable range of skewness and kurtosis for normal distribution of data?
A:
Q: 3. What is the test variate used when the population variance is unknown and when the population…
A: There are two tests used for testing the population mean i.e. t-test and z-test. The t-test is used…
Q: It is defined as the maximum likely difference between the observed sample mean and the true value…
A: Here Sampling Error is defined as the maximum difference between observed sample mean and…
Q: Hello. I appreciate any help. Thanks.
A: In this question we have to explain which measures of spread is considered as most resistance to…
Q: Define Sampling distribution of the Two Stage Least Square estimator?
A: Regression analysis of two-stage least squares (2SLS) is a statistical technique used in the…
Q: Is the Chebyshev's rule used only with populations? Are samples used as well?
A: Yes, Chebyshev’s rule can be applied to population as well as sample.We should know the following…
Q: 12. Normally distributed data are referred to as:
A:
Q: Describe the statistical pattern by which customers are generated over time must also be specified?
A: Queuing theory are used to measure the waiting, service level, service, waiting time, system etc.,…
Q: 11. According to heuristics, correlational studies require larger sample sizes than experimental…
A: 11) According to heuristics, correlational studies require larger sample sizes than experimental…
Q: suppose that for x=3, the predicted value is y=6. The data pair (3, 8) is part of the sample data.…
A: We know residual in regression equation is r = (y-y^) where, y is actual value y^ is predictive…
Q: 8. Show that the sample median is a consistent estimator for population mean of a normal…
A:
Q: What does it mean that a sample statistic is an unbiased estimator of a population parameter?
A: A statistic is called an unbiased estimator of a population parameter if the mean of the sampling…
Q: Discuss the concept cases and formulas regarding Statistical Inference of Two Samples.
A: Given information: Statistical inference is the process of drawing conclusions about populations…
Q: Discuss the different techniques in describing the data using measures of central tendency and…
A: Central Tendency (CT) It shows where the majority of data lie. Variability (V) It shows how far…
Q: What are Sources of variability and F ratios in one- and two-factor ANOVAs?
A:
Q: According to Chebyshev's theorem, what is the maximum proportion of data values from a data set that…
A: Given K=1.5
Q: The . distribution might be used if one cannot guess much about the process to involve in a…
A: If we know only the minimum and maximum values of the data then the most useful distribution for the…
Q: Assume that among diabetics the fasting blood level of glucose is approximately normally distribute…
A:
Q: find out Microsoft’s alpha, beta, and the fraction of its variance attributed to market risk.
A: To find the required alpha and beta values, we need to fit a regression model between Microsoft's…
Q: The Kyoto Protocol was signed in 1997, and required countries to start reducing their carbon…
A: (1) State the hypotheses. That is, there is no enough evidence to show that the mean CO2 emission…
Q: 1. It is possible to obtain a sample of scores with a weak, moderate, or strong correlation…
A: Whether the given statement is true or false
Q: 3)Which measure of central tendency is the most affected by extremely high or extremely low scores…
A: There are three types of measure of central tendencies. Mean: The mean is the sum of observations…
Q: 4, Suppose you are testing four population means from independent samples where the QQ plot shows…
A: Given :
Q: In a distribution plot, if mean is much smaller than median, does the underlying sample have very…
A: Outliers- It is an observation or a value that lies outside from the population or which is far away…
Q: What is the Empirical Rule and how does this rule apply to a normal distribution of data?
A: We have to define the Empirical Rule and how does this rule apply to a normal distribution of data.
Q: Describe the basic requirements that a data set must meet before it may be subjected to statistical…
A: Statistics is the branch of applied mathematics where we can do collection, analysis, interpretation…
Q: 3. If instead we use a 1% significant level, the results v [ Select ] statistically significant. are…
A: As per instruction, we are asked to solve part 3 only Given Data :
Q: Given a normally distributed data, what is the area of the region less than one standard deviation…
A: Given that Empirical rule: Approximately 68% of a data from a normal distribution lies within 1…
Q: When you have significant results in data analysis, it is not necessary to report all relevant means…
A: Statistical significance is the likelihood that the difference in conversion rates between a given…
Q: the best measure of central tendency for a data set containing a high number of single-sided…
A: In this case, we need to identify the given statement is true or false.
Q: 2. Why is it necessary to have more than one method for measuring central tendency?
A: Measures of center: Mean: The arithmetic mean (also called the mean) is the most commonly used…
Q: Explain the concept of Large-Sample Distribution of the Two Stage Least Square Estimator?
A:
Q: 1. Does correlation imply causation?
A: It is an important part of statistics. It is widely used.
Q: In a test of significance, the hypotheses are stated in terms of: statistics. statistics or…
A: Answer : we know that test of significance is a procedure to access the truth of a hypothesis…
Q: Provide one sample problem of Analysis of Variance (ANOVA)
A: ANOVA or the Analysis of Variance, is the process of comparing more than two samples and their…
Q: WHAT STATISTICAL ANALYSIS IS USED IN Measuring the Gadgets Usage of Children at Home during…
A: The usage of gadgets by children at home during quarantine can be analyzed by calculating mean hours…
Q: 13. What is the Relative Risk for these data?
A: The given data set is, The formula for calculating the relative risk is,
Q: A critical part of inferential statistics involves determining how far sample statistics are likely…
A: Inferential statistics have two main uses: making estimates about populations (for example, the…
Q: If the underlying population of study is not normally distributed, how large should the sample size…
A: Introduction: Define X as the random variable of interest here. Suppose that X has a distribution…
Q: In our ANOVA calculation, we want our within-group variation to be higher than the between-group…
A: Question based on ANOVA

Step by step
Solved in 2 steps with 1 images
