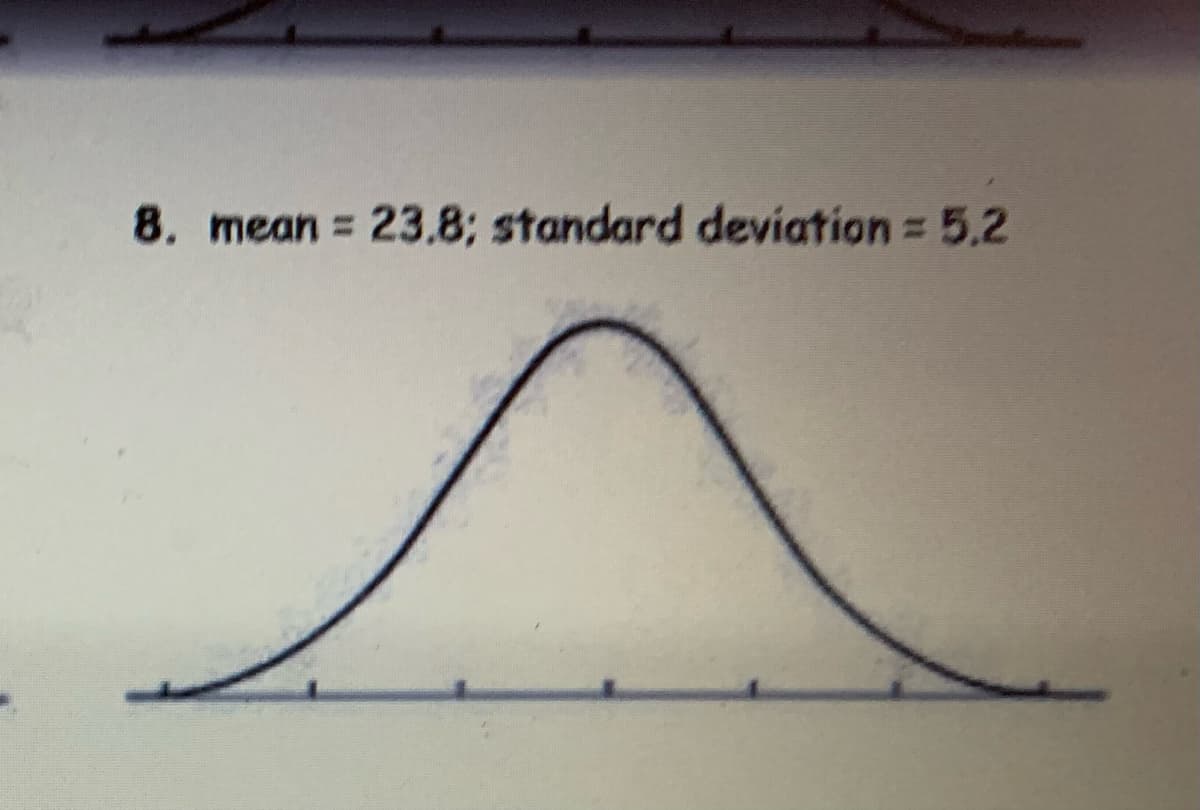
8. mean = 23.8; standard deviation = 5,2


Q: What is the interquartile range for the following set of numbers? 4, 5, 6, 8, 9, 11, 13, 16, 16, 18,…
A: Solution
Q: 48% of all violent felons in the prison system are repeat offenders. If 33 violent felons are…
A: Solution : p = 48% = 48/100 = 0.48 n = 33 Let x be the number of violent felons in the…
Q: 5.4 a) Approximately how many employees make $77,000 or more per year? b) What is the bin width…
A: Given the histogram, the graph shows the distribution of salaries (in thousands of dollars) for the…
Q: Use the normal distribution of SAT critical reading scores for which the mean is 515 and the…
A:
Q: Find the score for which 70% of the distribution's are a lies to the right?
A: P ( Z>z ) =0.70 Find z = ?
Q: Which of the following accurately describes the critical region? A. sample means that are very…
A: The critical region, also known as the rejection region, is a set of values for the test statistic…
Q: A bus company wants to su for public transit. The comp For each method, describe a) Placing…
A: Sampling is a process of selecting representative subjects or cases of a population into a sample.
Q: What is the Sample Skewness for the following numbers: mean of 101.67 , median of 95, and standard…
A: It is given that Mean = 101.67 Median = 95 Standard deviation = 55.89
Q: Class Interval 144-149 138-143 132-137 126-131 102 - 125 114-119 108-113 102-107 96-101 90-95 84-89…
A: For the given data Find the third Quartile =?
Q: Real-life Problem Apply the concept of measures of central tendency, write your ANSWER with COMPLETE…
A: Mean, Median and Mode are the measures of central tendency. Mean uses all the observations for…
Q: It is reported that the market share of iphones is 40%. (i.e. 40% of all cell phones are iphones)…
A:
Q: 7. mean = 60; standard deviation = 6
A: According to policy we supposed to answer first question kindly repost for remaining
Q: The following is the age distribution of 1,000 persons working in a large industrial house:…
A:
Q: Instruction: Dr. Jason wants to determine the spread of the scores of his two classes in their final…
A: Given that: Class A x f 90-98 3 81-89 7 72-80 7 63-71 11 54-62…
Q: 4.5.11. Let Y₁ 1 is accepted if the observed Y₁ 2 A (a) Find the constant c so that the…
A:
Q: 4: Two mathematics teachers working in a school want to compare whether there is a difference…
A: Given information: Teacher A Teacher B 78 83 60 45 51 54 50 44 45 15 40 40 27 71…
Q: A FREQUENCY DISTRIBUTION TABLE is a tabulated form of data consisting of two columns- class…
A: Given data: n = 30
Q: A population has a mean μ = 72 and a standard deviation a=27. Find the mean and standard deviation…
A:
Q: Suppose that Yt follows the Moving Average process of order 1 (MA(1)) model…
A:
Q: 12. Six coins of the same type are discovered at an archaeological site. If their weights on the…
A: It is given that Population mean, μ = 5.25 Sample mean = 4.73 Sample standard deviation = 0.18…
Q: researcher selects a sample and administers a treatment for anxiety to the individuals in the…
A: We have given that A researcher selects a sample and administers a treatment for anxiety to the…
Q: An automobile insurance company has determined the probabilities for various claim amounts for…
A:
Q: How many ways can we choose 3 numbers from the set (1, 2, 3, 4, 5, 6, 7) (The order we choose…
A: Permutation: It is nothing but the arrangement of items in a definite order where the order is…
Q: 5. What are the values of p and q? (Hint: notice this is binomial data, where p is the probability…
A: In rolling a die, the number of possible outcomes are {1,2,3,4,5,6}
Q: STATISTICS AND PROBABILITY (PLEASE SHOW your COMPLETE & CLEAR solutions) RATE WILL BE GIVEN In a…
A:
Q: 6.1 2) A college professor decided to examine whether or not there is a relationship between the…
A: Scatter graph is a type of graph that depicts the relationship between the two variables. There are…
Q: 10. mean = 54.2; standard deviation = 12.3 +
A:
Q: A researcher computes the correlation coefficient r= 0.4212 for an explanatory and response…
A: The correlation coefficient between an explanatory and response variable is r = 0.4212.
Q: Find the indicated area under the standard normal curve. To the left of z=2.47 Click here to view…
A: The standard normal variable is z, which follows the normal distribution with the mean of 0 and…
Q: Suppose X₁, X2,..., X30 is a random sample from a normal population with mean and variance 10. Find…
A:
Q: Clara and Ashildr are travel writers and both reviewed the Diamond resort on planet Midnight. Both…
A: Reliability analysis in statistics is about measuring consistency of statistical measures.
Q: TABLE 2.5 Student teachers are trained to develop lesson plans, on the assumption that the writ- ten…
A:
Q: An environmentalist wants to determine the relationships between the numbers (in thousands) of…
A:
Q: according to the deped, shs teachers work for an average of 46 hours and more per week during a…
A: Parametric test are used to measure the population by taking the sample and it follows any one of…
Q: Which describes a normal distribution with mean u and variance σ²? Its mode and median are both…
A: It is given that the normal distribution with mean μ and variance σ2. Here, need to find out the…
Q: A golf ball is selected at random from a golf bag. If the golf bag contains 8 brown balls, 6 yellow…
A: The following information has been given: The number of brown balls=8 The number of yellow balls=6…
Q: Petroleum pollution in oceans stimulates the growth of certain bacteria. An assessment of this…
A: The provided information is x x2 51 2601 48 2304 44 1936 69 4761 70 4900 60 3600…
Q: Problem in statistics: frequency of whose ith size x; is f; is given by : ositsi Prove that the mean…
A: Given that We have to prove that Mean deviation about the mean of variable x with frequency fi…
Q: Which of the following statements about sampling distributions is/are FALSE A. The mean of the…
A: The statement about sampling distribution are given.
Q: As the new manager of a small convenience store, you want to understand the shopping patterns of…
A: The question is about to find quartiles Given :
Q: Use the given frequency distribution to find the (a) class width. (b) class midpoints. (c) class…
A: Given freq. distribution table is Temp.( 0F) Freq. 32-36 1 37-41 3 42-46 5 47-51 11…
Q: Use the data from the table (attached image) to answer the following 3 questions. Calculate the…
A: Given information: Table A) Table representing the given data Age group (years) No. of male IHD…
Q: WHAT KIND OF SAMPLING TECHINIQUE IS USED IN THE FOLLOWING AND WHY? Financial Stability of Local…
A: Given information: Topic: Financial Stability of Local Businesses in the selected cities of Manila.…
Q: Answer: #8 (mode of given #1) Direction: Complete the table below by finding the mean, median and…
A: ( #1 ) #8 Mode = ?
Q: What is the Standard Deviation for the following numbers: Variance = 284
A:
Q: The marketing director of a large department store in Metro Manila wants to estimate the average…
A:
Q: Hablon Packaging Solution, Inc. is a food packaging manufacturing industry that produced sustainable…
A: a) Pareto chart: Excel Procedure: Enter the the data in Excel. Select the data in excel. Go to…
Q: Researchers developed a "cat IQ test" and find that the population of cats in the United States has…
A:
Q: Hablon Packaging Solution, Inc. is a food packaging manufacturing industry that produced sustainable…
A: Given information: Leaking Delamination Discoloration Puncture Wrinkles Tunneling 4/4/2022 5…
Q: Answer #17: (mode of given #4) Direction: Complete the table below by finding the mean, median and…
A: Given data set is, (1) 23,21,28,29,23 (2) 83,82,80,85 (3) 31,33,39,36,33 (4) 23,22,28,27,29,30 (5)…

Step by step
Solved in 2 steps with 1 images
