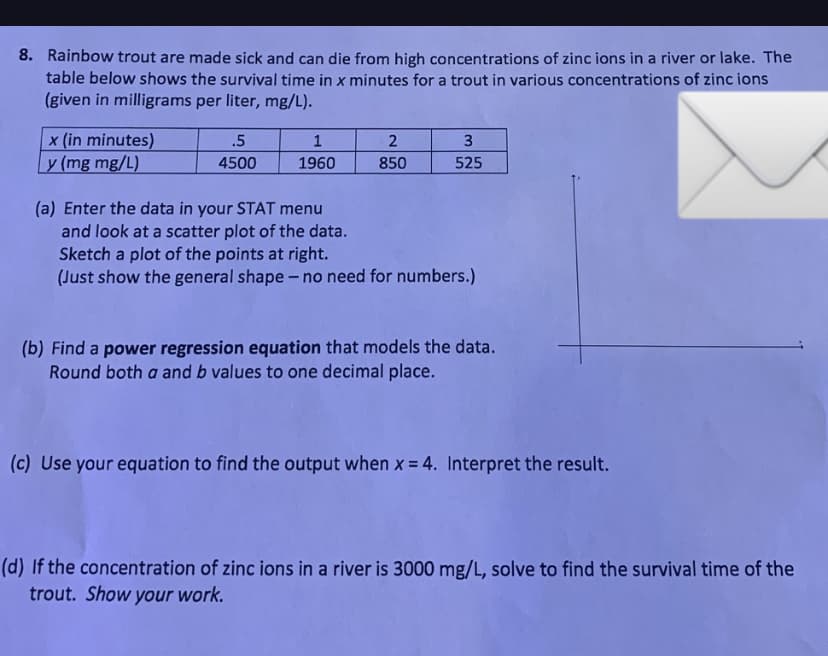
8. Rainbow trout are made sick and can die from high concentrations of zinc ions in a river or lake. The table below shows the survival time in x minutes for a trout in various concentrations of zinc ions (given in milligrams per liter, mg/L). x (in minutes) y (mg mg/L) .5 4500 1 1960 2 850 3 525 (a) Enter the data in your STAT menu and look at a scatter plot of the data. Sketch a plot of the points at right. (Just show the general shape - no need for numbers.) (b) Find a power regression equation that models the data. Round both a and b values to one decimal place. (c) Use your equation to find the output when x = 4. Interpret the result. d) If the concentration of zinc ions in a river is 3000 mg/L, solve to find the survival time of the trout. Show your work.
8. Rainbow trout are made sick and can die from high concentrations of zinc ions in a river or lake. The table below shows the survival time in x minutes for a trout in various concentrations of zinc ions (given in milligrams per liter, mg/L). x (in minutes) y (mg mg/L) .5 4500 1 1960 2 850 3 525 (a) Enter the data in your STAT menu and look at a scatter plot of the data. Sketch a plot of the points at right. (Just show the general shape - no need for numbers.) (b) Find a power regression equation that models the data. Round both a and b values to one decimal place. (c) Use your equation to find the output when x = 4. Interpret the result. d) If the concentration of zinc ions in a river is 3000 mg/L, solve to find the survival time of the trout. Show your work.

Functions and Change: A Modeling Approach to College Algebra (MindTap Course List)
6th Edition
ISBN:9781337111348
Author:Bruce Crauder, Benny Evans, Alan Noell
Publisher:Bruce Crauder, Benny Evans, Alan Noell
Chapter5: A Survey Of Other Common Functions
Section5.4: Combining And Decomposing Functions
Problem 18E

Related questions
Question
Transcribed Image Text:8. Rainbow trout are made sick and can die from high concentrations of zinc ions in a river or lake. The
table below shows the survival time in x minutes for a trout in various concentrations of zinc ions
(given in milligrams per liter, mg/L).
x (in minutes)
y (mg mg/L)
.5
4500
1
1960
2
850
3
525
(a) Enter the data in your STAT menu
and look at a scatter plot of the data.
Sketch a plot of the points at right.
(Just show the general shape - no need for numbers.)
(b) Find a power regression equation that models the data.
Round both a and b values to one decimal place.
(c) Use your equation to find the output when x = 4. Interpret the result.
(d) If the concentration of zinc ions in a river is 3000 mg/L, solve to find the survival time of the
trout. Show your work.
Expert Solution
This question has been solved!
Explore an expertly crafted, step-by-step solution for a thorough understanding of key concepts.

This is a popular solution!

Trending now
This is a popular solution!

Step by step
Solved in 4 steps with 3 images

Recommended textbooks for you
Functions and Change: A Modeling Approach to Coll…
Algebra
ISBN:
9781337111348
Author:
Bruce Crauder, Benny Evans, Alan Noell
Publisher:
Cengage Learning

Algebra & Trigonometry with Analytic Geometry
Algebra
ISBN:
9781133382119
Author:
Swokowski
Publisher:
Cengage

Functions and Change: A Modeling Approach to Coll…
Algebra
ISBN:
9781337111348
Author:
Bruce Crauder, Benny Evans, Alan Noell
Publisher:
Cengage Learning
Algebra & Trigonometry with Analytic Geometry
Algebra
ISBN:
9781133382119
Author:
Swokowski
Publisher:
Cengage

Trigonometry (MindTap Course List)
Trigonometry
ISBN:
9781337278461
Author:
Ron Larson
Publisher:
Cengage Learning

Algebra and Trigonometry (MindTap Course List)
Algebra
ISBN:
9781305071742
Author:
James Stewart, Lothar Redlin, Saleem Watson
Publisher:
Cengage Learning

College Algebra
Algebra
ISBN:
9781305115545
Author:
James Stewart, Lothar Redlin, Saleem Watson
Publisher:
Cengage Learning